Evolution of the NHL Defenceman - Part 6
Defencemen taking more shots and improving their playmaking has generally helped their teams, but the expected goals tell another story.
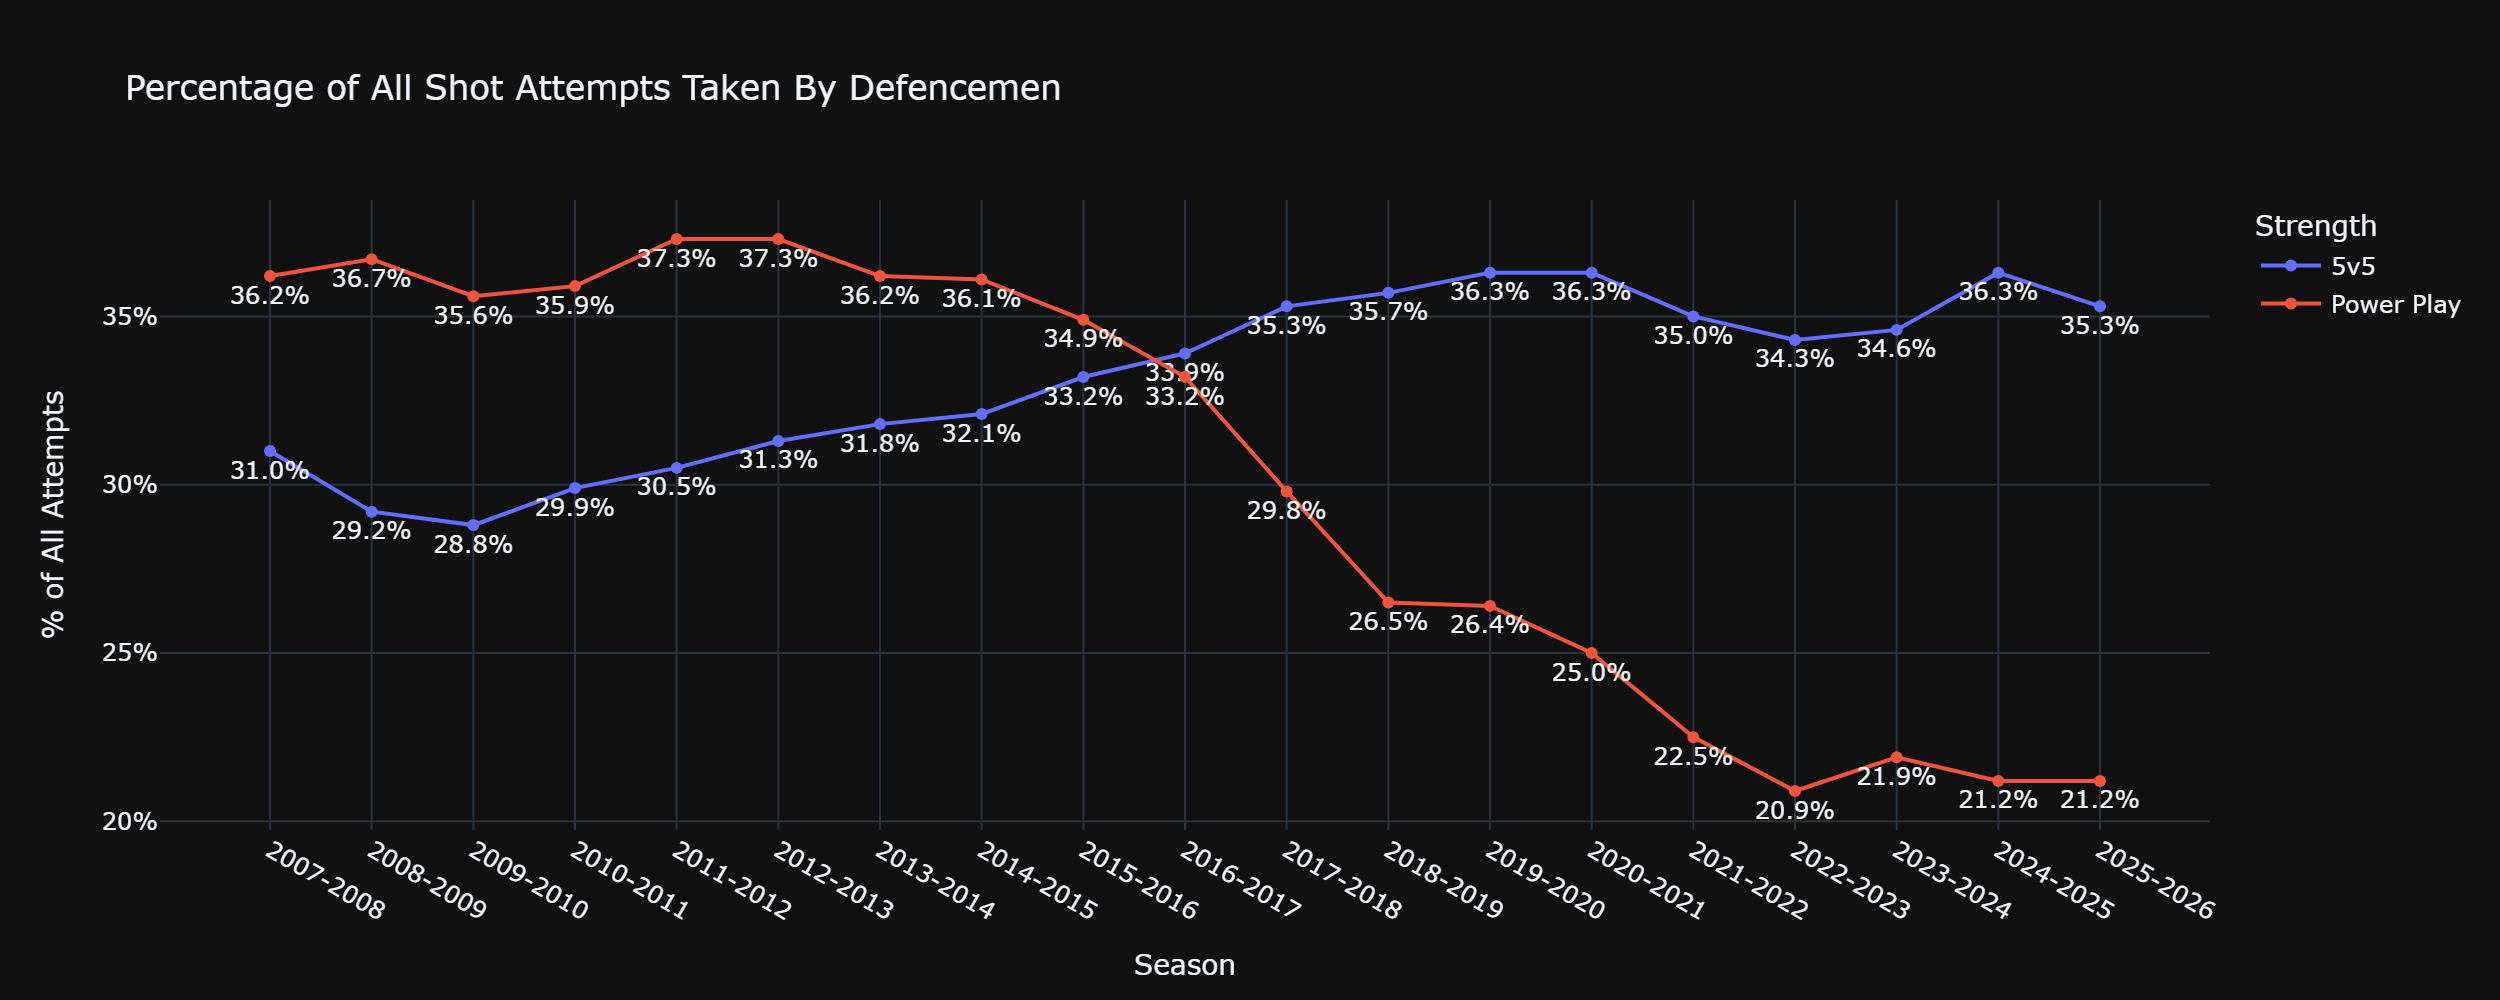
Back in the first part of this series, we saw how the share of a team’s 5-on-5 shot attempts coming from defencemen started rising late in the 2000s, peaked in 2019-2021, and has stabilized at an elevated rate since. As a reminder, this is what it looked like when we split 5-on-5 from the power play:
Shot attempts are just one component of all shooting, though. Shot attempts lead to shots on goal, which is what leads to goals. There are also expected goals, which help us quantify shot quality from either the player or the team.
It is one thing to register a lot of shot attempts, but it is another to turn them into shots on goal. We just saw how 5-on-5 shot attempts from defencemen started rising in 2009 before plateauing a decade later. How does that compare to just 5-on-5 shots on goal? Very similar, actually:
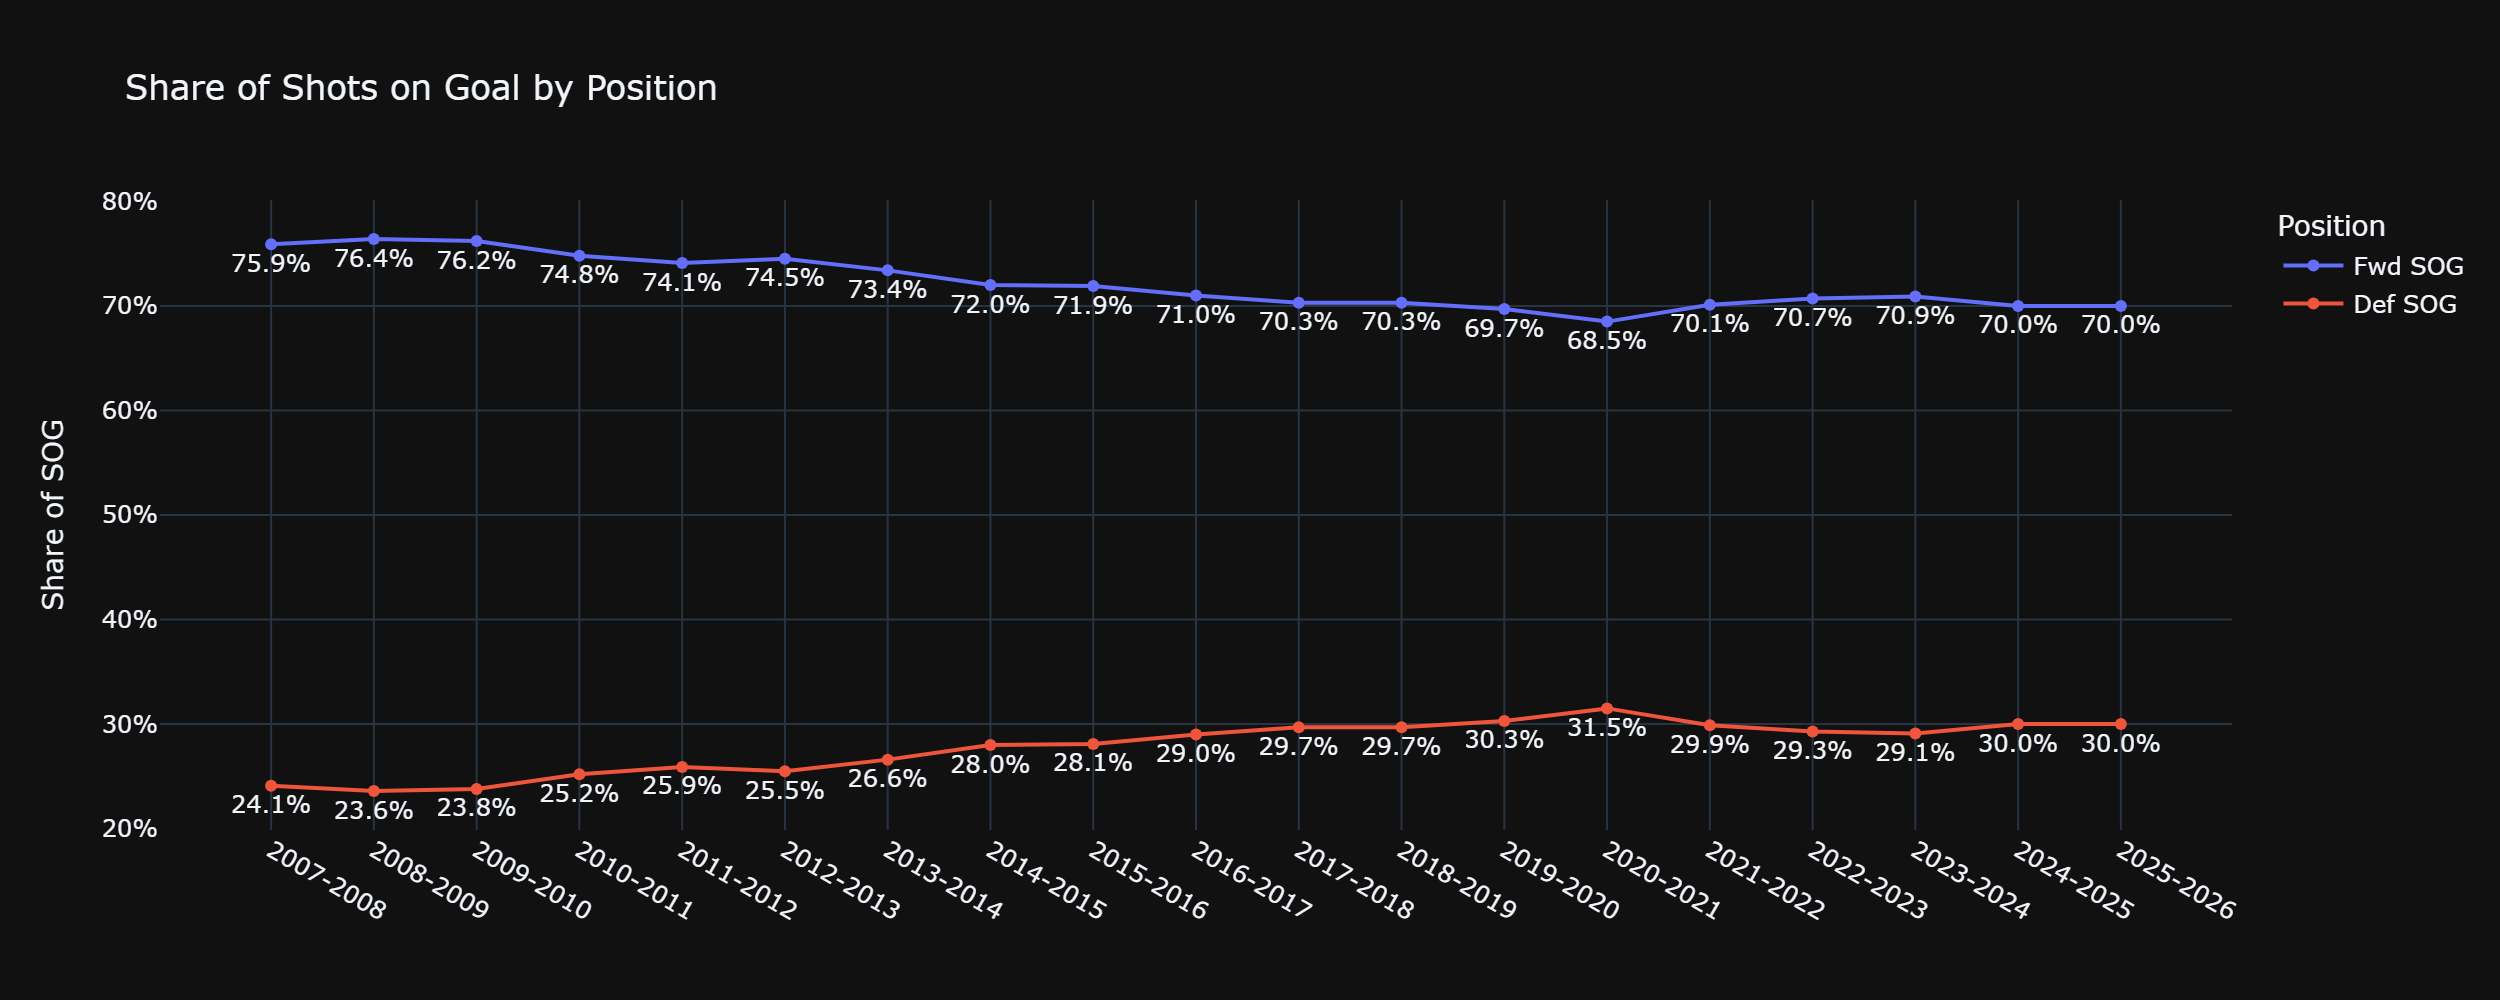
We see how defencemen reached a low of under 24% from 2008-2010, that rose over 30% from 2019-2021, but has flattened out to the 29-30% range over the last five years. The interesting part is that not only has there been a mirrored rise and plateauing as with shot attempts, but the relative increase has been much larger than when reviewing just the shot attempts:
· The low-water mark for share of shot attempts by defencemen was in 2009-2010 at 28.8%. The high-water mark came 10 years later at 36.3%. That difference is a relative increase of 26%.
· The low-water mark for share of shots on goal by defencemen was 23.6% in 2008-2009. The high-water mark was 31.5% in 2020-2021. That difference is a relative increase of 33.5%.
If we exclude that 56-game Bubble season, and take the percentage from the year before, the increase in SOG share among defencemen is 28.4%, which still outstrips the increase in shot attempts. If we take the percentage from 2021-22, or the first full post-COVID season, the rise in SOG share among defencemen is 26.7%, and still slightly higher than the rise in share of shot attempts. No matter how we slice it, defencemen were taking more shot attempts, but they weren’t wasting them as they were leading to even more shots on goal.
Shot attempts and shots on goal increased, and the share of shots on goal saw a bigger relative improvement than the share of attempts. However, we know that, as a group, defencemen take lower-quality shots than forwards. If the blue liners were taking a lot more attempts, landing more shots on goal, but there wasn’t an increase in the shot quality, that could create scoring problems for their teams (barring rebounds, deflections, and the like). This is where things get a bit more interesting because as we saw with shot attempts and SOG, there was an expected goal uptick starting in the late 2000s, peaking in 2021 Bubble season. The difference is that the share of both shot attempts and SOG by defencemen stabilized over the last five seasons, and even saw an increase from 2024-2026 compared to 2022-2024, but the share of expected goals by defencemen has declined each of the last five years:
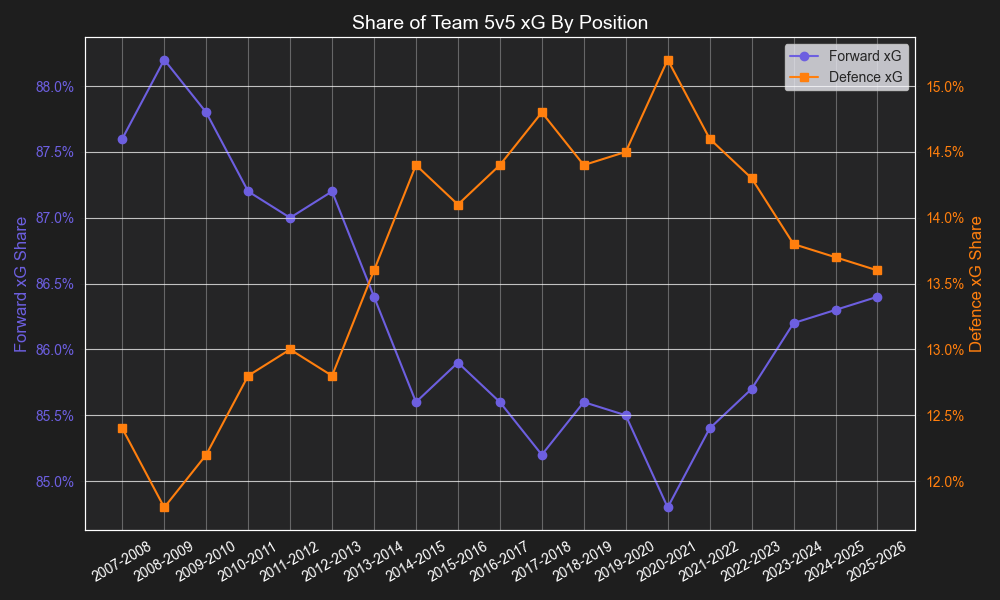
The 2025-26 season saw defencemen comprise roughly 13.6% of the expected goals at 5-on-5, a rate similar to what they posted over a decade earlier in 2013-14. That was not the case with shot attempts (35.3% and 31.8%) nor with SOG (30% vs 26.6%). The rise in expected goals from blue liners followed a similar trajectory to shot attempts and SOG for about a decade, but the similarities ended a few years ago.
As we’ve done before, we’ll see whether this helped or hurt their teams. We are going to split the league into two groups: teams whose defencemen took an above-average share of expected goals and then a below-average group. Going back to 2007-2008, here are the 5-on-5 goal shares of those two groups:
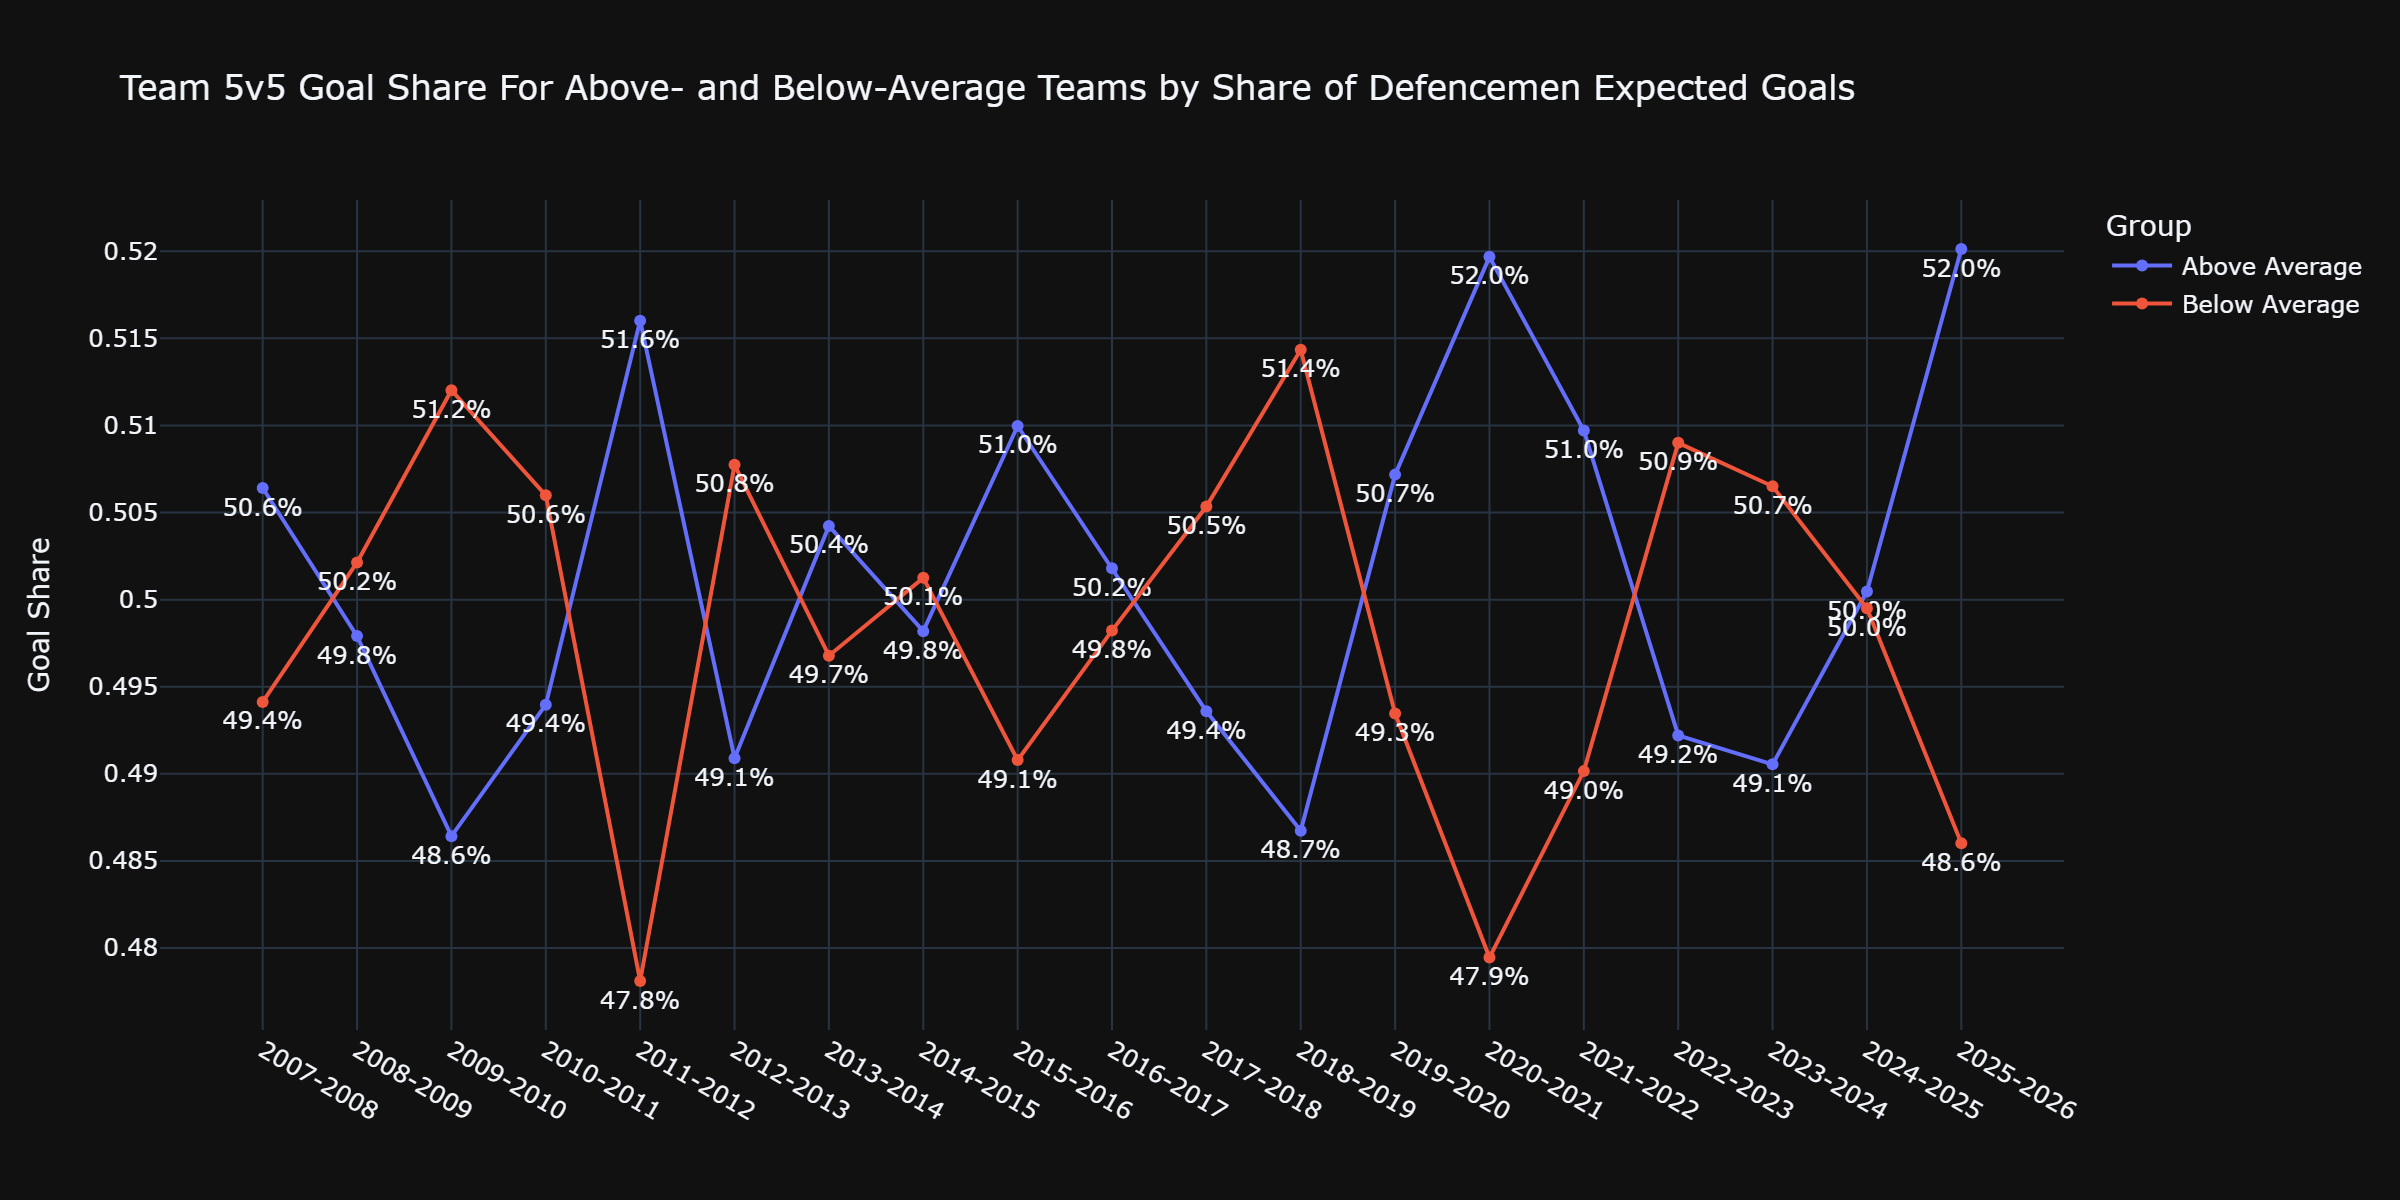
The results are, in a word, mixed. Out of the 19 seasons in our data, the above-average group has the edge in goal share in 10 of them and the below-average group in nine. Last week’s article showed that teams whose defencemen had an above-average rate of playmaking or zone exits generally fared much better, and had for several years. That is not the case when looking at share of expected goals.
When we did the penalty kill analysis back in Part 3, we had similarly muddled results that became clearer if we took the eight teams with the highest share and the eight teams with the lowest share rather than splitting all teams in two groups. That helped illustrate the impact a little better. What if we did the same here for expected goal share? Well:
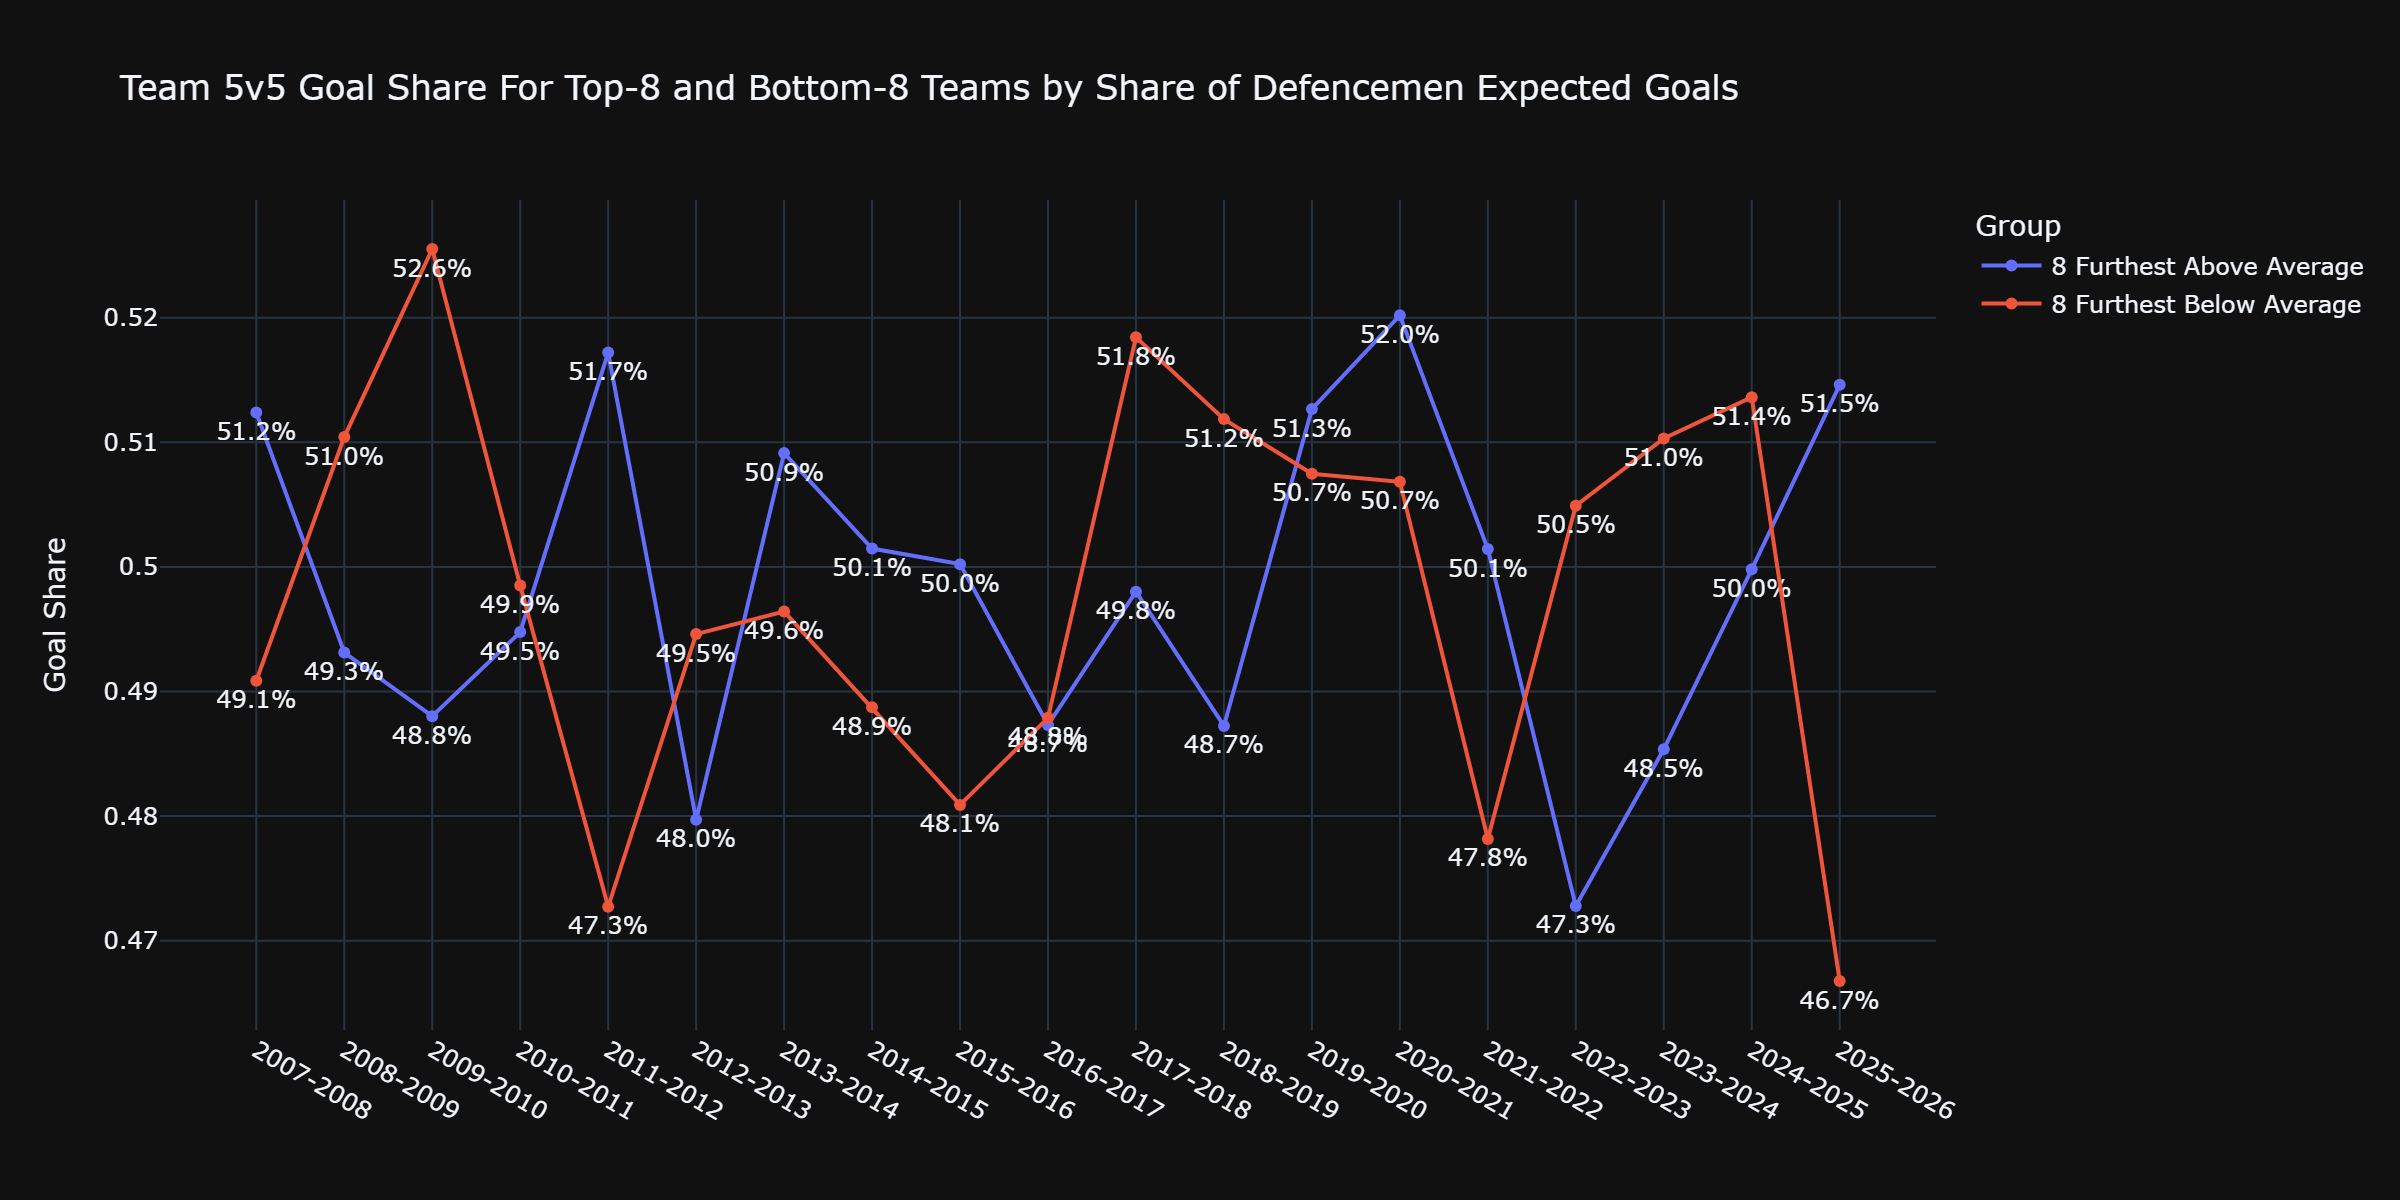
We see muddled results again until the last few years. In 2022-23, the eight teams furthest above the league-average defencemen xG share bottomed out with a 47.3% goal share. That number has steadily risen each of the last three years and far exceeded the eight teams the furthest below the average in 2025-26. One year of differential doesn’t make a pattern, but it is very interesting that the eight above-average teams now have the only three-year increase from the above-average group in our 19 seasons.
This is where we have to mention the changes made to expected goals thanks to puck tracking. Analysis done by CJ Turtoro (and others like Aaron K.) earlier this year showed that starting in 2023-24, when the NHL more formally adopted league-wide chip-tracking for player and shot locations, shots that were designated as occurring around the crease 7-8 years ago (and earlier) were moved closer to the net. A big function of any expected goals model is proximity to the net, so if a shot that was once registered as being from 8 feet away is now being registered as being from 7 feet away, that will over-inflate the expected goal of that shot. Forwards are far more likely to take shots from the crease area than defencemen, so it would over-inflate some of their shots and deflate the shots from the rearguards.
I don’t have an expected goals model, so the workaround here will be using goals per shot attempt. Goals and attempts are either/or events – either the shot was attempted/goal was scored or it wasn’t – so it avoids the expected goal tracking issue while still determining if defencemen getting involved offensively is helping their teams. Here are the 5-on-5 goal shares for teams whose defencemen’s goals per shot attempt were above- or below-average in each season:
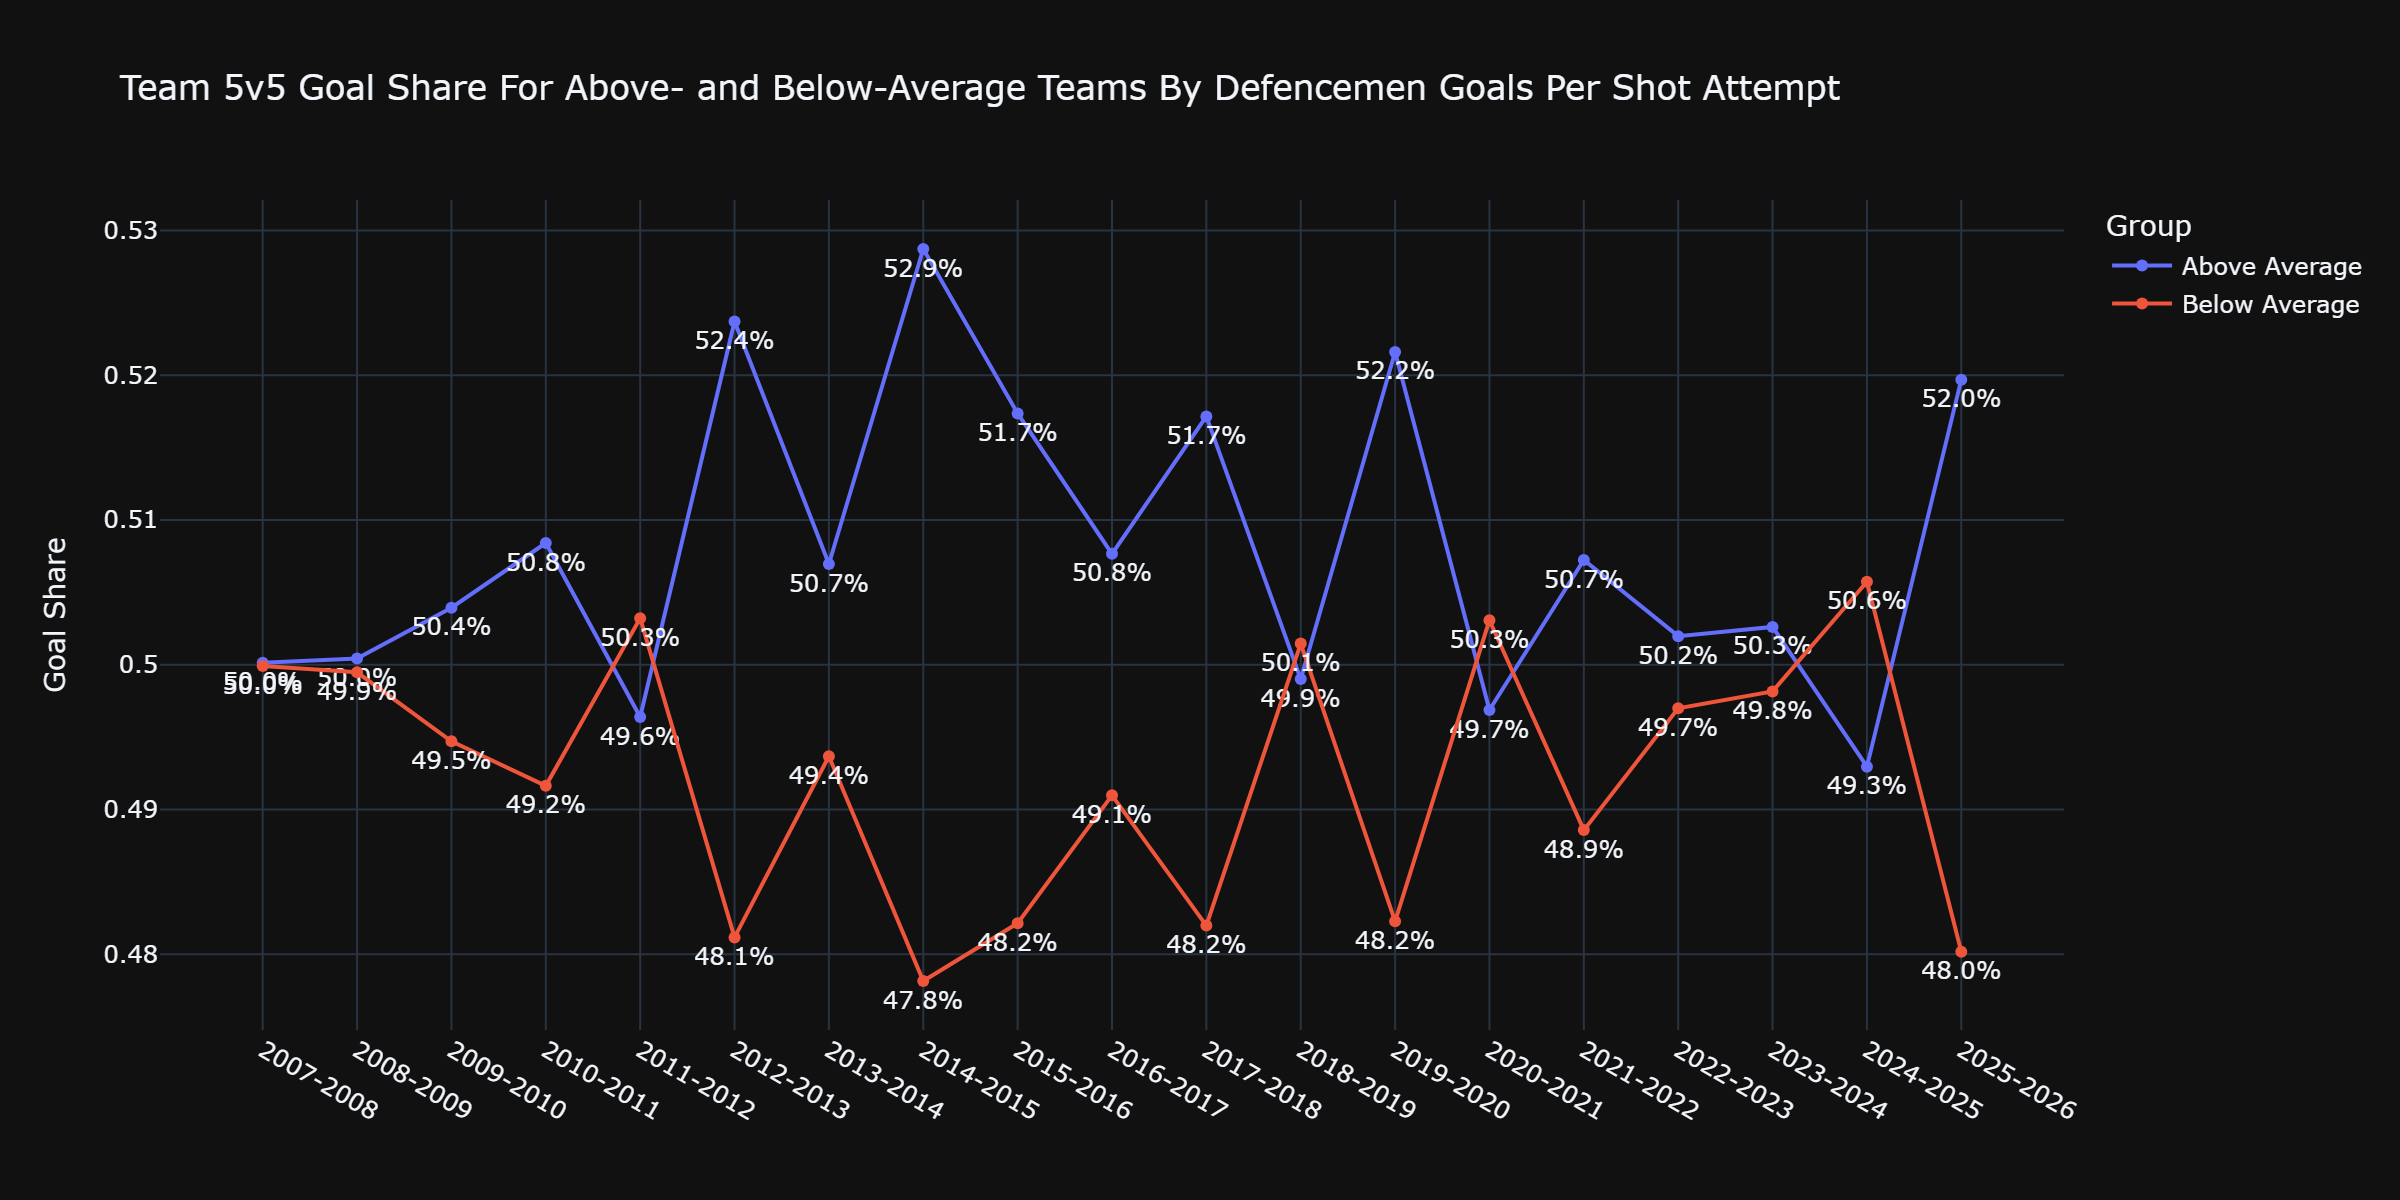
This is a bit clearer. Of the 19 seasons in our data, the two groups were near even in three of them, but the above-average group had the edge in 13/19 campaigns. What should be noted is that in five of the last six years, the groups were within the 49-51% range before a clear delineation in 2025-26. Whether this is the start of a new trend as we had in 2012-13 or a one-year blip as we saw in 2019-20 is the unanswerable question, and that gives us something to keep tabs on for the upcoming season.
Next week, we’ll dig into how much poor offensive defencemen have really been helping or hurting their teams.