Evolution of the NHL Defenceman - Part 5
Changes in tracking data from defencemen is one thing. Whether it helps or hurt their teams is something else.

In last week’s edition of this series, we reviewed how some tracking data has changed among blue liners over the last decade. We will touch on zone entries and exits a little later, but the big takeaway from the write-up was the change in playmaking. There has been a massive increase in defencemen assists on teammate shots, completing high-danger passes, and jumping into the cycle/forecheck (especially last year). Defencemen aren’t just responsible for starting the offence with a good breakout pass, they are expected to find their teammates for scoring chances.
Now that we’ve established those changes, and just as we did with the penalty kill, we have to figure out whether these changes are a positive development for their teams or not. We will use the same set of tracking data from All Three Zones and combine that with team goal scoring provided by Evolving Hockey. The data only goes back to the 2016-17 season and will exclude the Bubble 2021 campaign.
Primary Shot Assists
Getting the blue line more involved in the playmaking is one thing, but whether it is helping teams score or create better goal differentials are other matters entirely. Back in Part 3, when we reviewed changes on the penalty kill, we saw how teams whose defencemen were trying to get involved offensively on the PK was filled with mixed results until the last few years.
With that in mind, let’s start with primary shot assists, or the final pass that leads to any kind of teammate shot. We are going to separate each season into two groups: teams whose defencemen had a share of the shot assists higher than the league average and teams whose defencemen had a share of the shot assists lower than the league average. Going back to 2016-17, here are the combined goals-for rates per 60 minutes at 5-on-5 of those two groups:
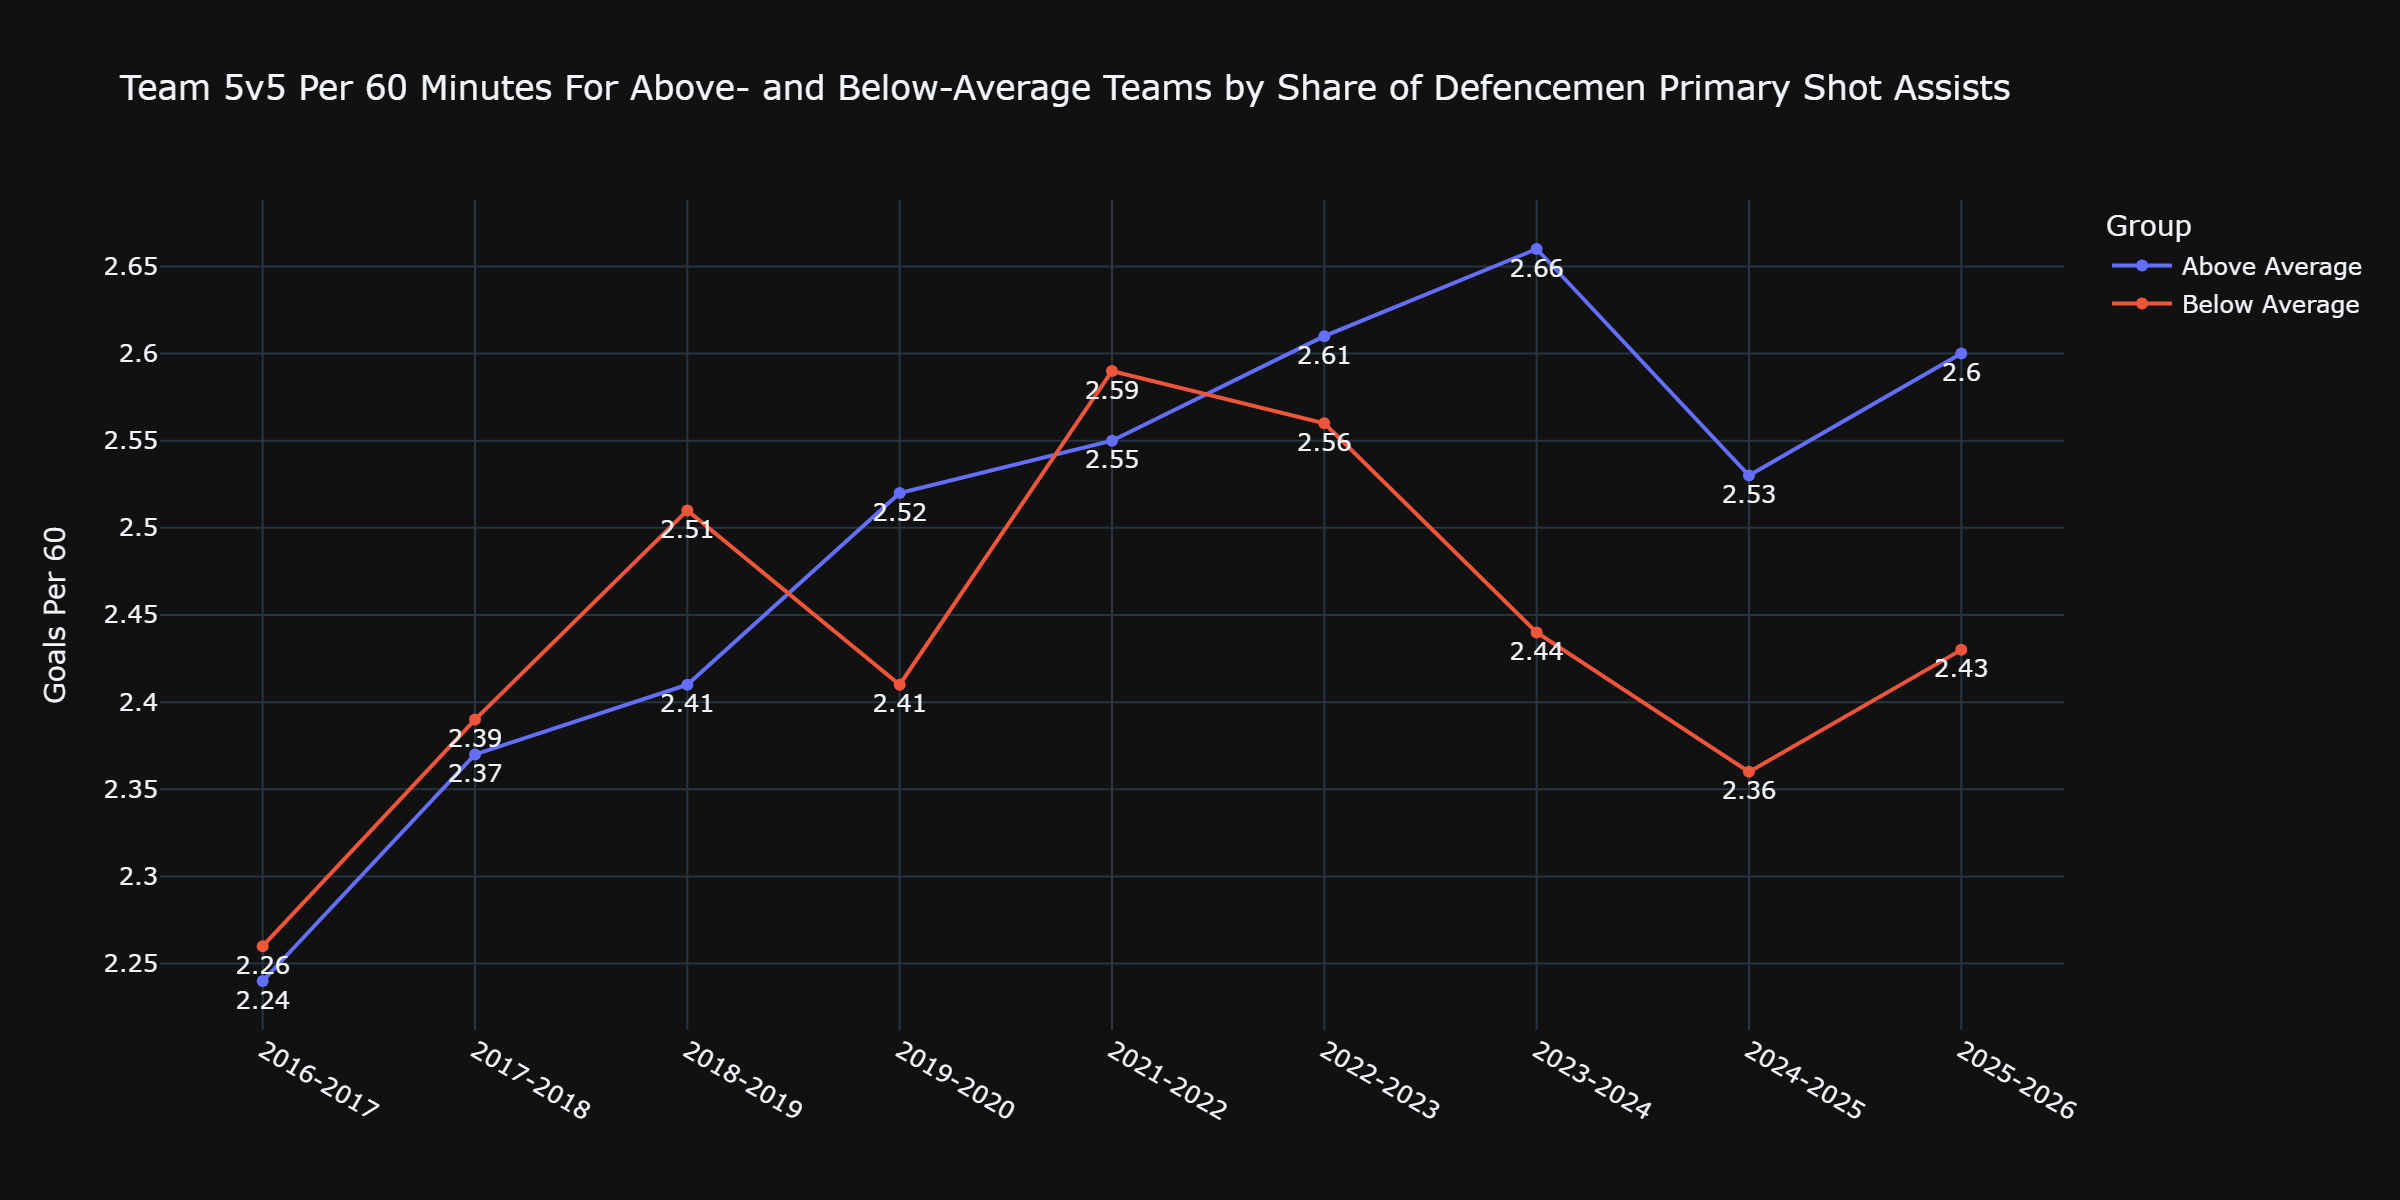
Again, we see some mixed results for several years before an explosion over the last few seasons. It is indeed the case where teams whose defencemen had a share of the shot assists above the league average scored much more often than their counterparts. This past season, that was roughly the difference between being the Dallas Stars and being the St. Louis Blues. The year before, it was roughly the difference between being the Toronto Maple Leafs and being the New York Islanders.
This makes intuitive sense. If teams have skilled blue liners, getting them involved in the playmaking adds more options to their offensive attack. More options can get the defending team running around and free up shots for the offensive team. The results were back-and-forth for a while, but after four seasons of the above-average group exceeding their counterparts, that is settled for now.
Scoring more often doesn’t necessarily translate to a better goal differential, though. It could very well be the case that teams whose defencemen are responsible for more playmaking duties have higher goal-scoring rates but being caught out of position results in even higher goals-against rates. If we look at the goal share for the above- and below-average shot assist teams, what does that tell us? Well…
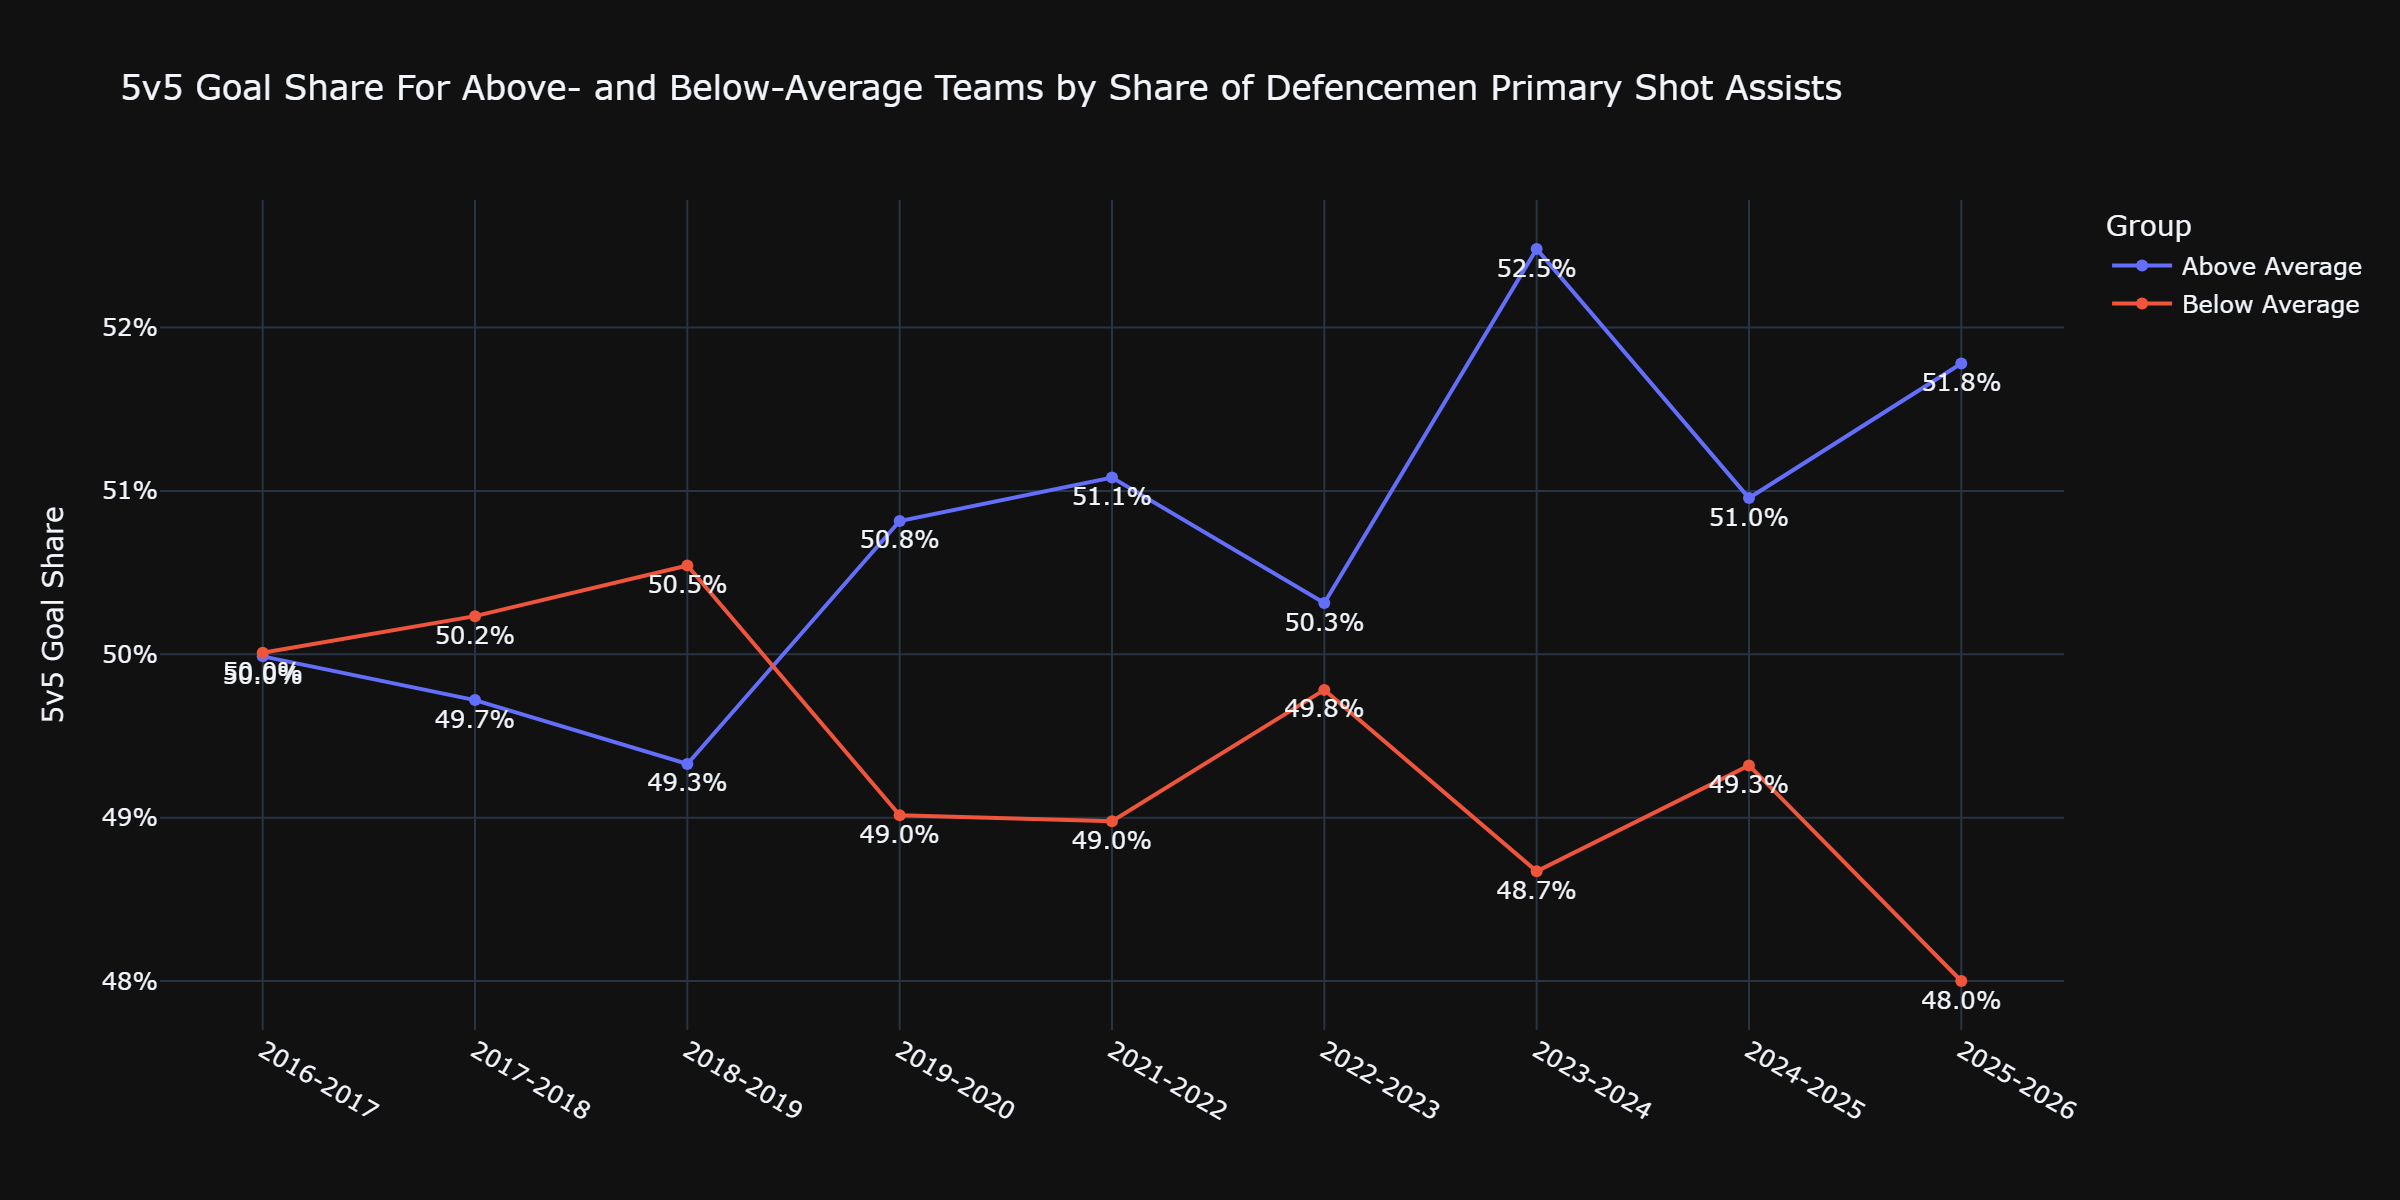
This is the telling graph. There are mixed results again early on, but we have now seen six straight seasons of teams whose defencemen are above-average by percentage of their team’s shot assists out-performing the below-average teams in terms of the share of goals scored. This past 2025-26 campaign alone, we see the difference between 51.8% and 48%. Depending on how much time a team spends at 5-on-5 in a given season, that is roughly a 25-goal swing, or the difference between the Los Angeles Kings (a playoff team) and the Calgary Flames (missed the postseason by 13 points).
Zone Exits
The other big takeaway from last week was the change in responsibilities on zone exits. Forwards had been eating into the share of zone exits before flattening out over the last few years. If we do the same thing we just did with primary assists, and look at the goal share of the above- and below-average teams by share of zone exits by defencemen, what do we find? An interesting pattern, that’s what:
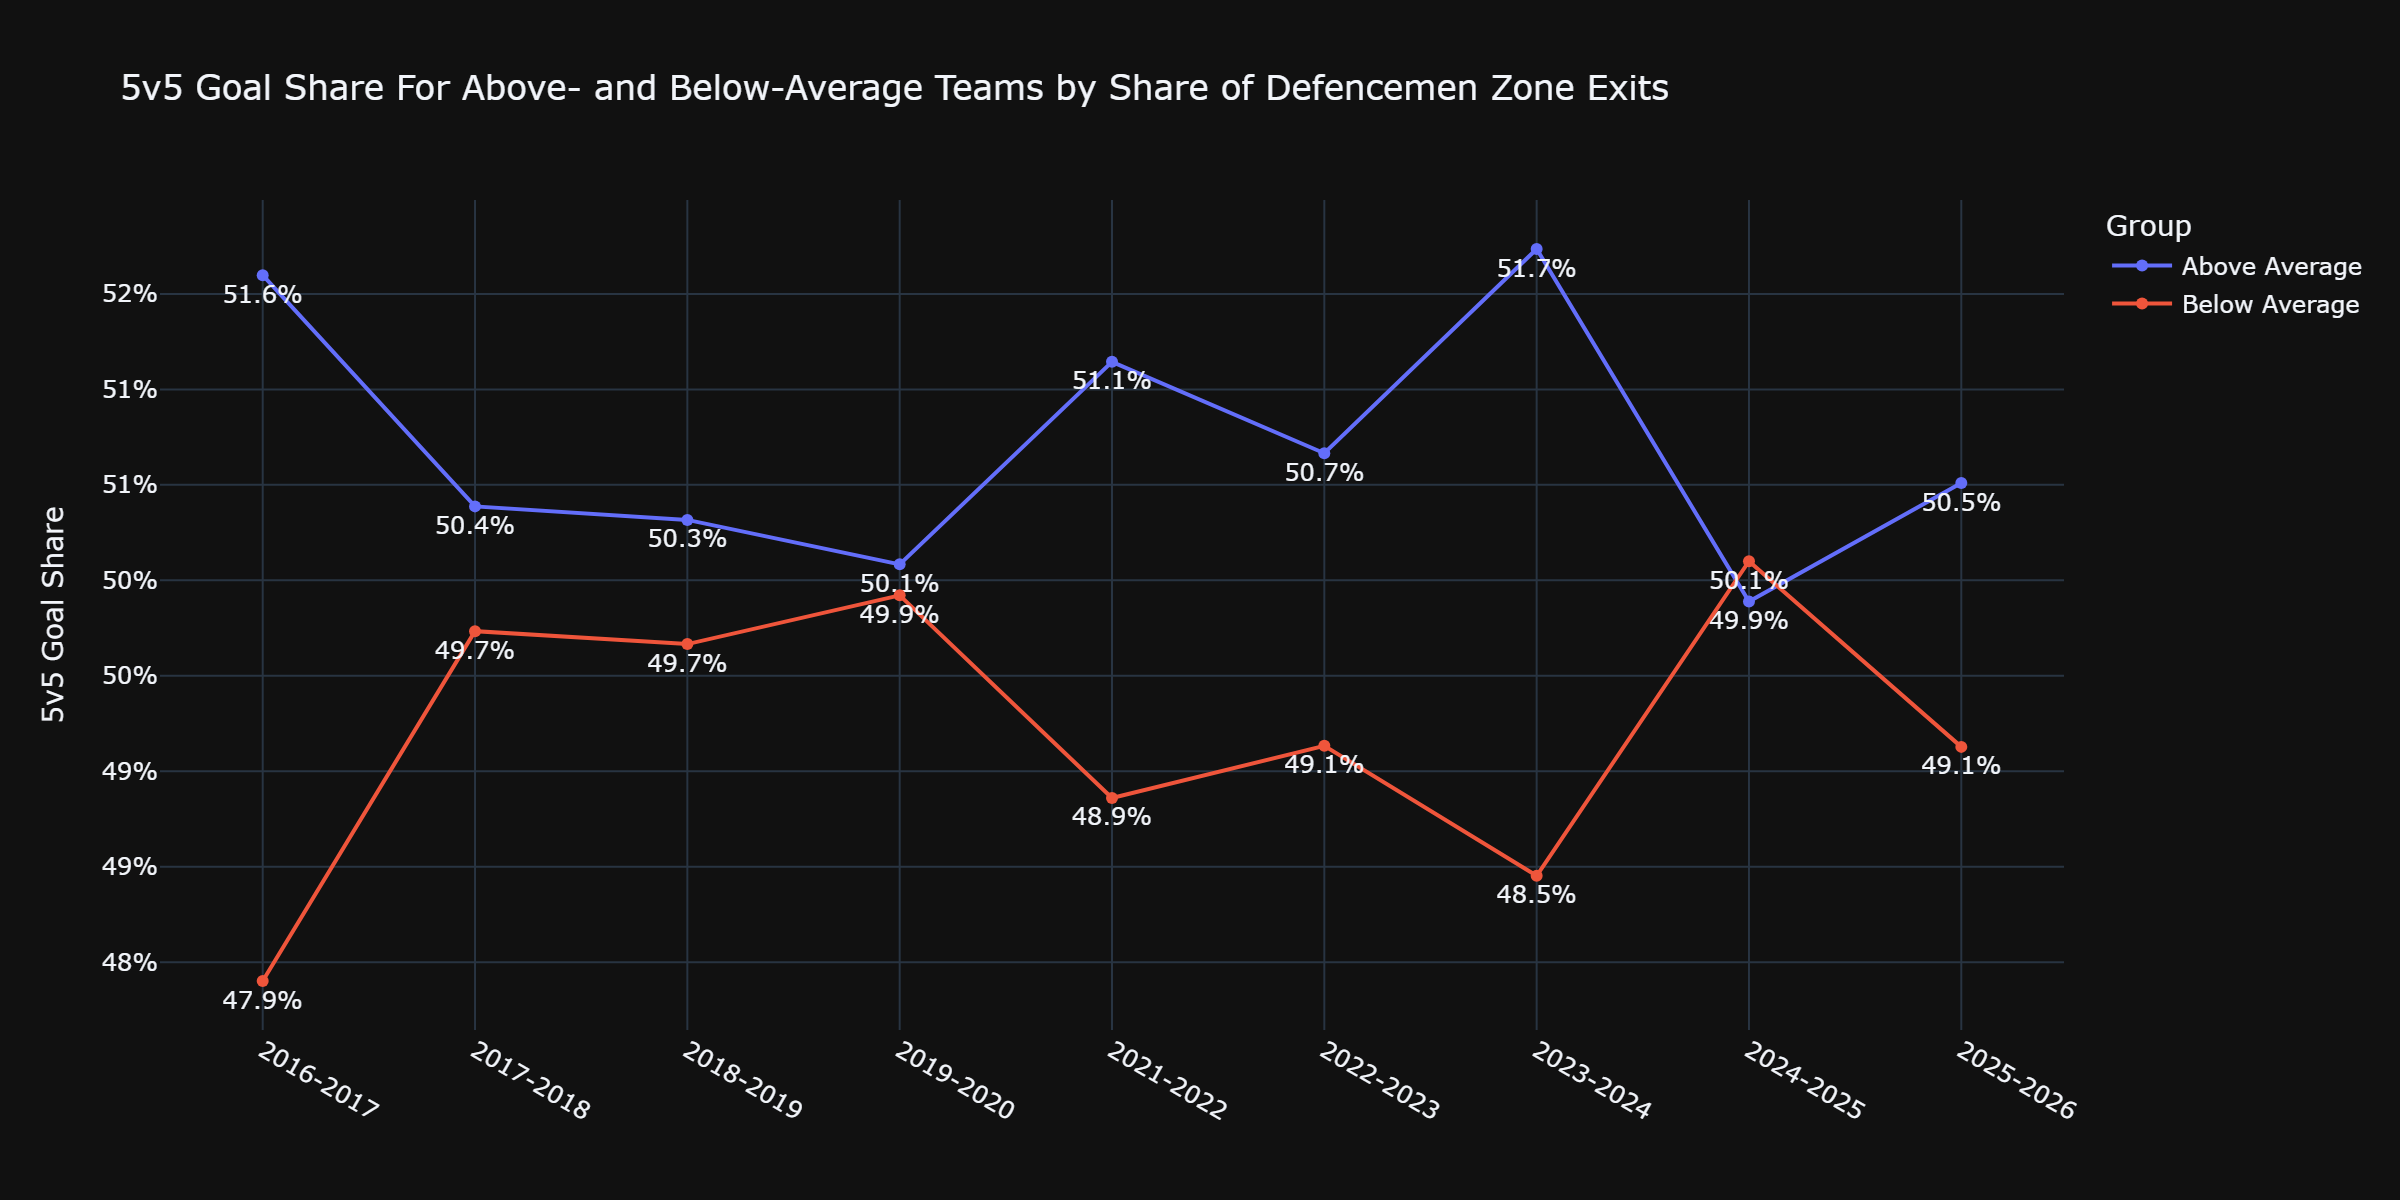
From 2016-2024, teams whose defencemen were responsible for more of the zone exits than their forwards had the higher goal share. There are a few close seasons, but then the three post-COVID campaigns saw the disparity grow.
Then we get to the last two years. In 2024-25, we have our first instance of the below-average group outperforming the above-average cohort, and then the 2025-26 season saw the next-smallest gap since the pre-COVID years. It is truthful to say that the above-average group were better than the below-average group for years, but it is also truthful to say that the last couple of seasons have given us mixed results and nothing definitive. Knowing what you don’t know is useful, and right now, we can’t be sure if this emerging pattern is helpful or harmful.
Staying with zone exits, let’s look at exits with possession. Referring back to last week, we saw that even as the share of zone exits has stabilized over the last four seasons, the share of exits with possession by defencemen keeps dropping. What if instead of using all zone exits, we split into above- and below-average groups again and focus on just the exits with possession?
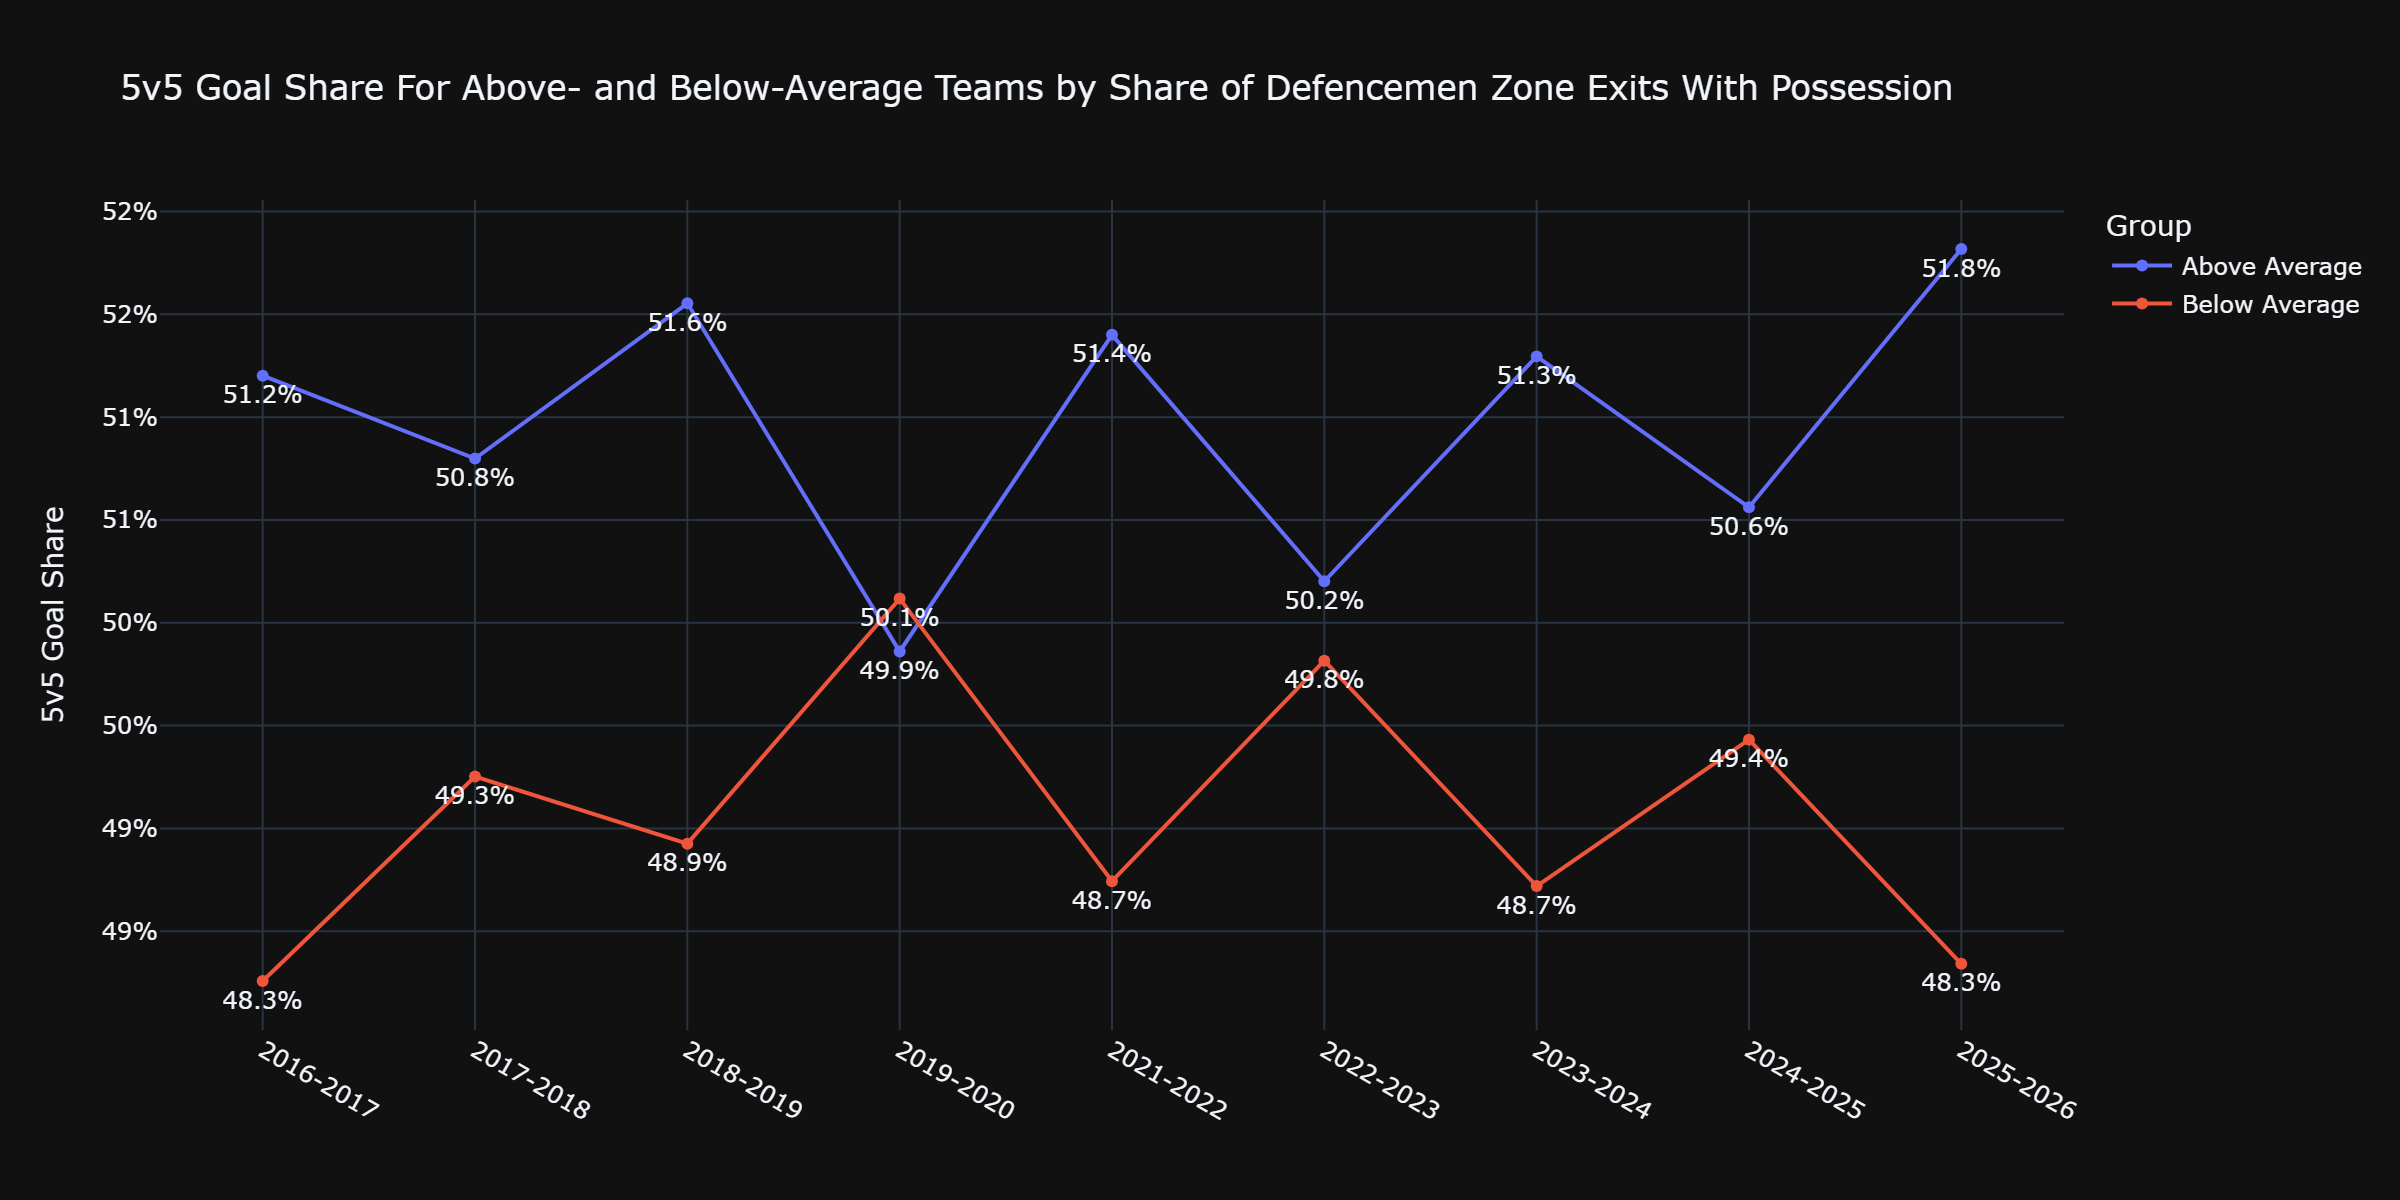
There are two interesting things about this graph.
The first is that we see a push/pull relationship. The goal share between the two groups grows and shrinks each successive season, and it’s a wonder if this isn’t just coaching adjustments – a sort of cat-and-mouse game. Teams start using their forwards more to break out of the zone, so the defending squad focuses more on cutting off the play by the forwards, so the opposition starts relying on their defencemen to get the puck out with control, and the dance repeats itself. It is just one possibility, but it makes sense to me with this kind of pattern.
The second area of interest is that unlike with all zone exits, the possession zone exits show a much more clear delineation between the two groups. All five post-COVID seasons tip in favour of the above-average group, and this past season saw the largest disparity so far. If our pattern holds, this will reverse itself to some degree in 2026-27, but that is notable.
One of the foundational hockey-isms I learned years ago was from analyst Kent Wilson. He wrote, “Blocking shots is like killing rats. Doing it is preferable to not, but if you’re doing it all the time it suggests you have bigger problems.” What we’re seeing with possession exits made me think of that quote. Every team encourages their forwards to help their defencemen get the puck out cleanly, but if teams are relying on forwards to do it more than they should, it might suggest a bigger structural problem like their zone exit tactics or puck skills of their blue liners.
Remember that these aren’t hard-and-fast rules – exceptions always exist. This past season, the Vegas Golden Knights’ defencemen had the fourth-worst percentage of their team’s possession exits and made it to the Stanley Cup Final. However, of the 12 teams with the highest share of possession exits by defencemen, five made it past the first round of the postseason (Buffalo, Montreal, Carolina, Anaheim, and Colorado). That means just three of the other 20 teams made it to the Elite Eight.
Next week, we’ll move away from tracking data and towards data from public models.
Until then.