Evolution of the NHL Defenceman - Part 4
We have already seen significant changes in defencemen participating in the offence. Where those changes are coming from offer a bit of a surprise.

In Part 1 of this series, we saw how the share of 5-on-5 assists from defencemen exploded in the 2010s, going from roughly 28% of all assists 15 years ago to over one-third of all assists this past season. It might not seem like a huge increase but based on the number of goals scored in 2025-26, that amounted to nearly 500 more assists. On a per-minute basis, it means the difference between the average defenceman producing assists at the rate of Brock Faber or the rate of Ty Emberson.
This isn’t some aberration or sample of a few seasons where the data might be lying to us. Rather, this is the culmination of several years of blue liners getting more involved offensively and the dividends showing up on the score sheet. To hammer this point home, let’s take the tracking data from All Three Zones which goes back to the 2016-17 season. Using ‘Primary Shot Assists’, which is the pass that leads to a teammate’s shot, we can see the dramatic rise in just how much defencemen have been jumping into the offence at 5-on-5:
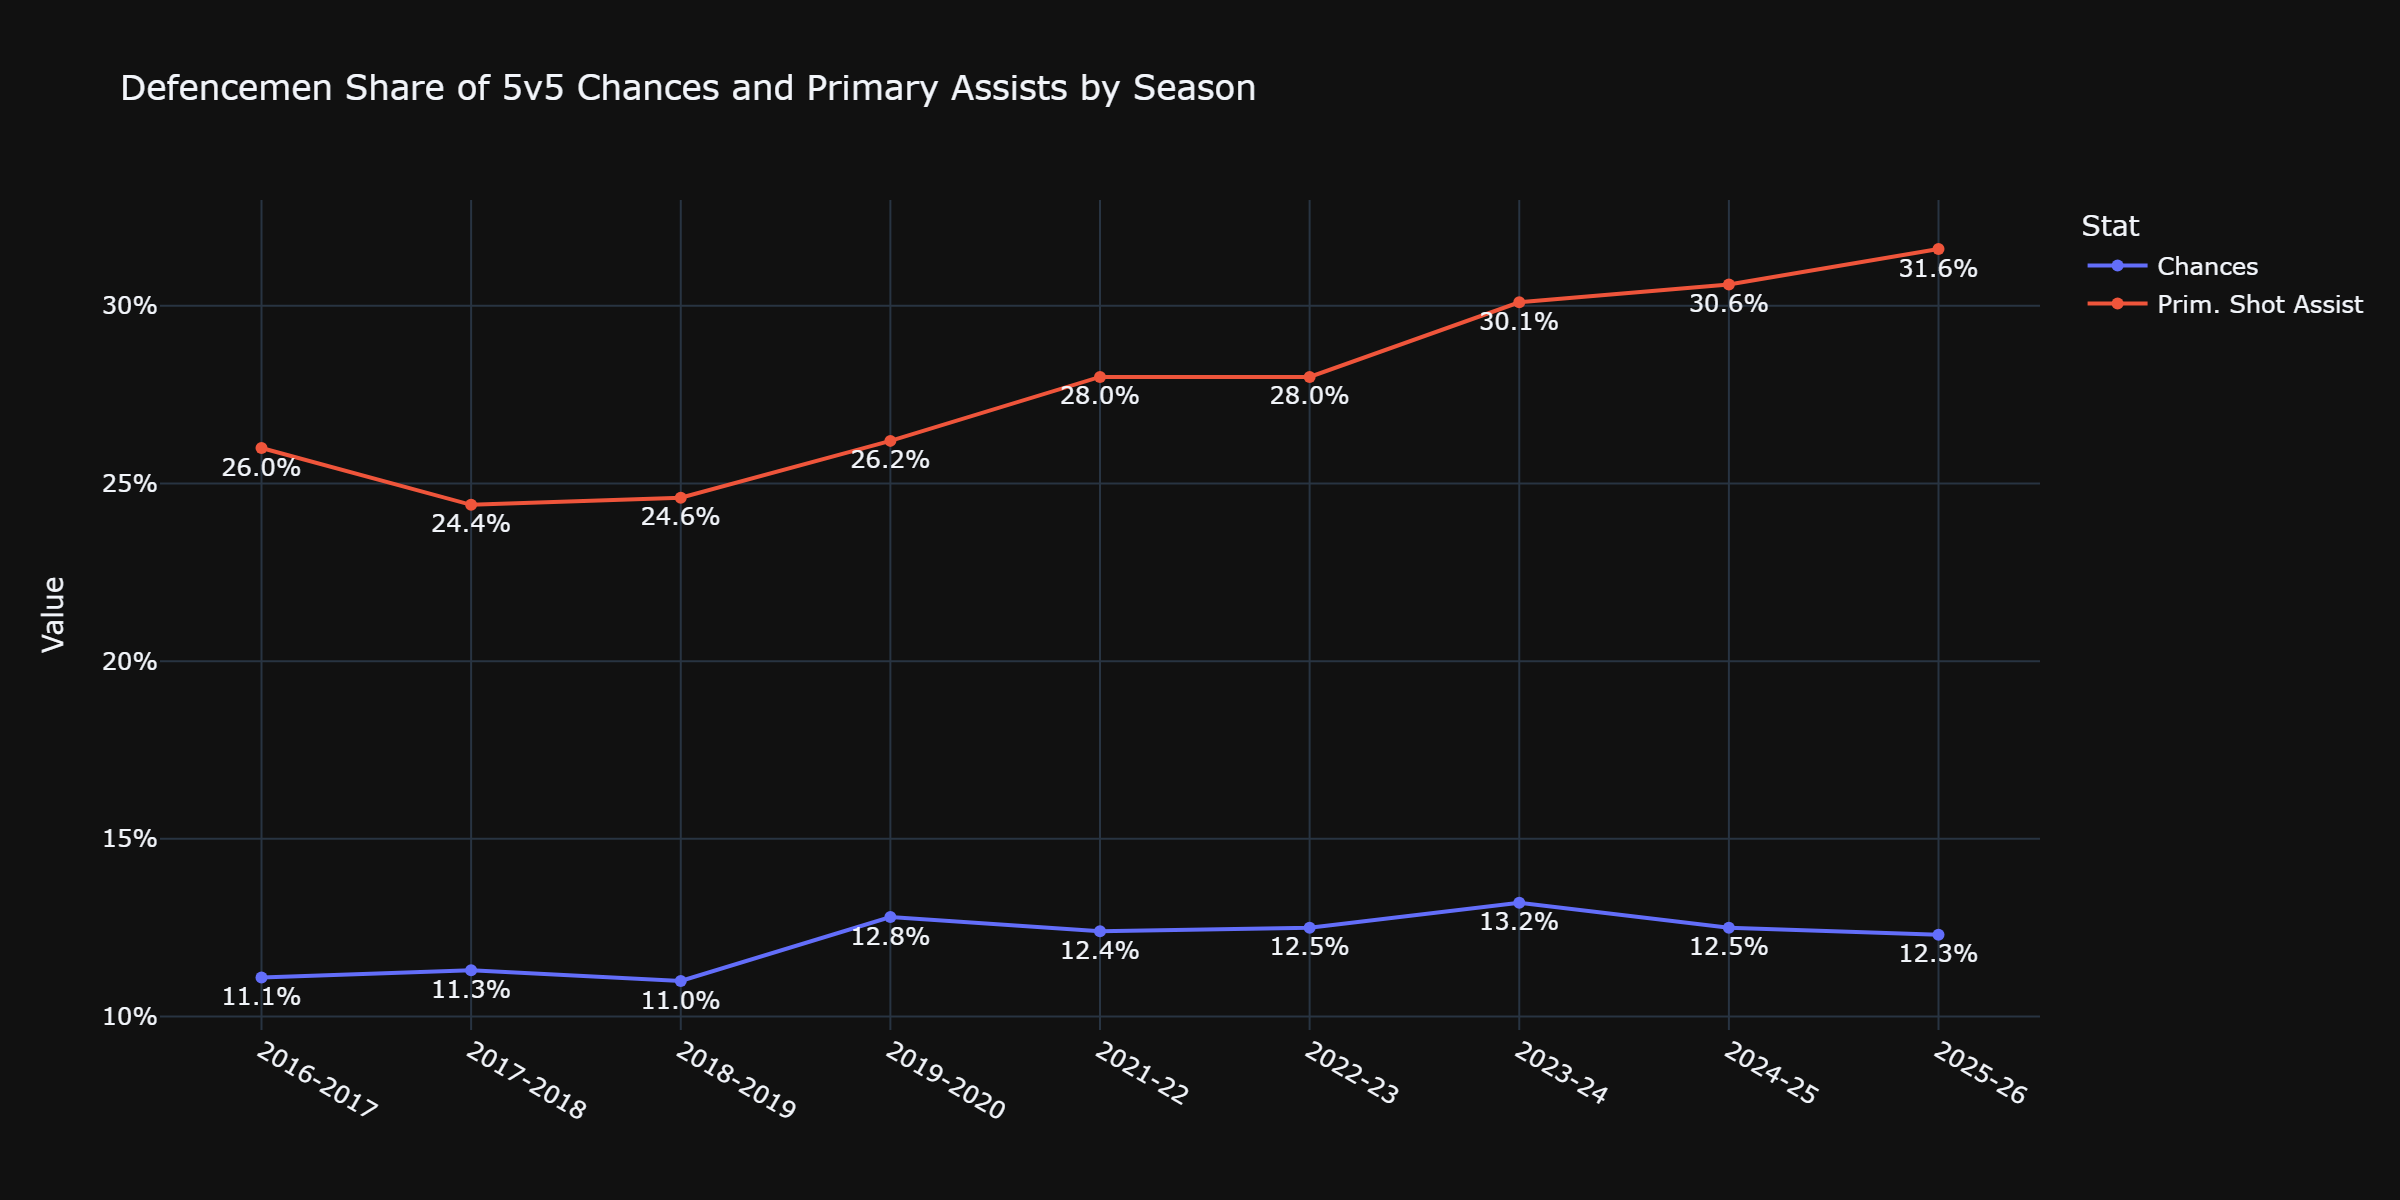
Scoring chances are included and we’ll get back to that, but for now we’ll focus on the primary shot assists. Going back a decade – the Bubble 2020 excluded – we see how the share of shot assists by defencemen has climbed from 24.6% to 31.6% in just six seasons. Relatively speaking, that is an increase of nearly 30%. The share of 5-on-5 assists hasn’t risen nearly as much in that span – less than 10% – but that doesn’t take away from just how much more defencemen aren’t only responsible for moving the puck up the ice but setting up their teammates for shots (and hopefully goals).
It isn’t just any pass leading to a shot that has seen an increase, either, because passes leading to a slap shot from five feet inside the blue line don’t quite have the same impact as a sharp pass across the slot for a one-timer from 20 feet away. That is why it’s crucial to note that not only has there been a dramatic rise in all passes leading to a shot, but that the percentage of high-danger passes created by defencemen (passes across the slot or from behind the net) has increased by over 50% in the last eight years:
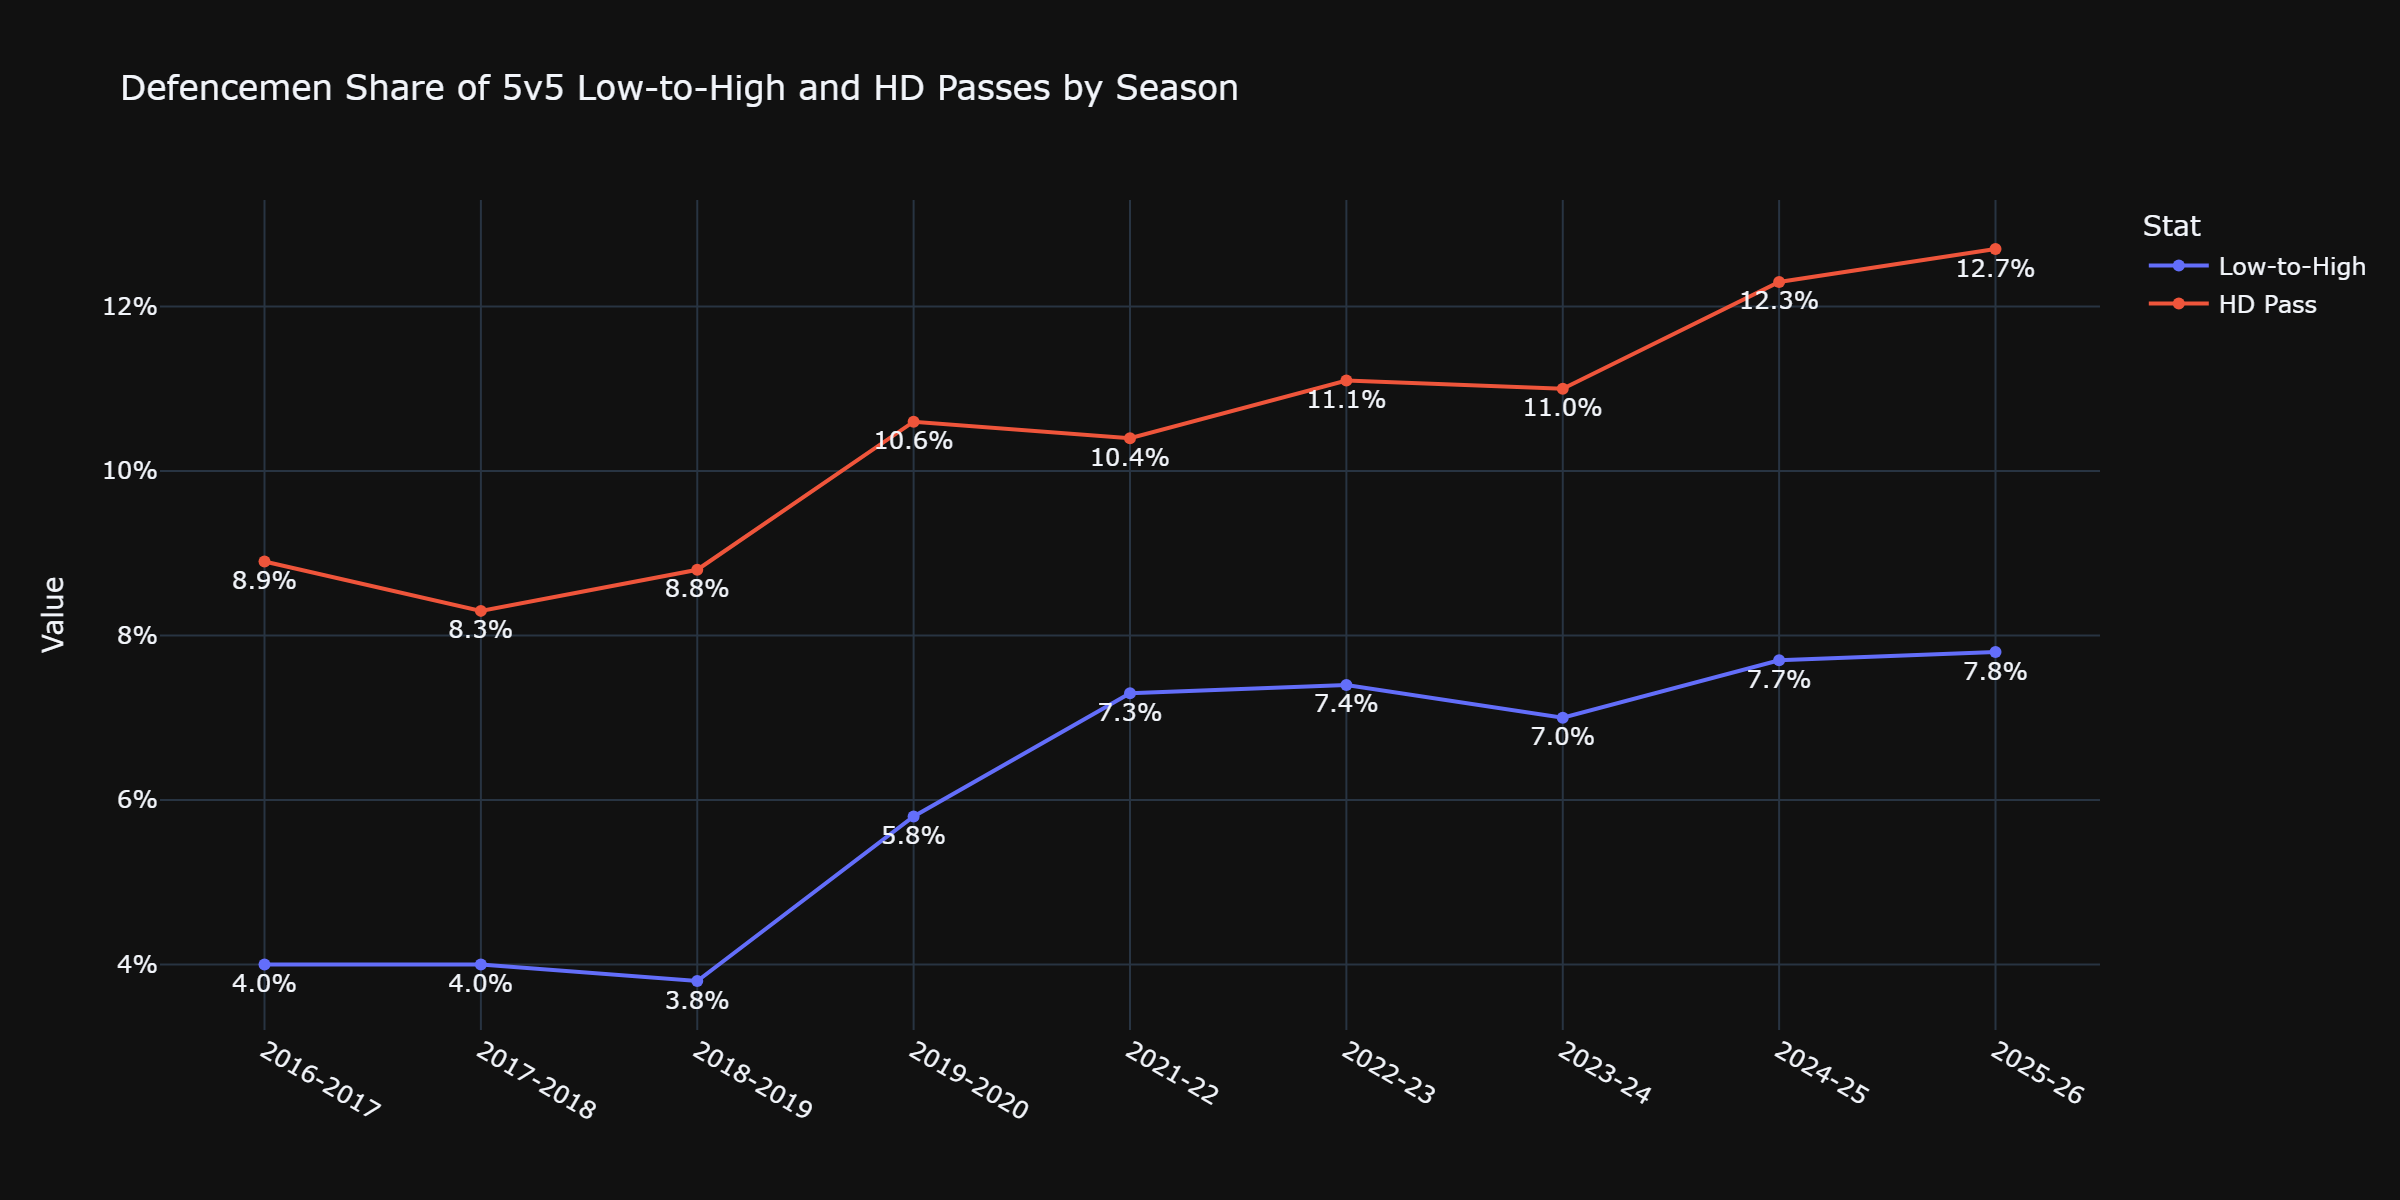
The blue line just isn’t jumping into the offence – they are creating far more dangerous shots for their teammates than at any point in the last 10 years. That is also coming at a time when their low-danger low-to-high passes (passes out to the blue line for a shot) is staying constant, too.
They aren’t just creating more dangerous shots for their teammates but are getting more chances for themselves. As noted in the first graph, from 2016-2019, defencemen accounted for between 11% – 11.5% of all scoring chances at 5-on-5. In the six seasons since, that rate has been between 12.2% – 13.2%. The gap between the lowest valley (2018-19) and the highest peak (2023-24) is an improvement of 20%. As noted in Part 2 of this series, the share of 5-on-5 goals coming from defencemen has been on a steady rise since the early 2010s. We don’t have tracking data going back that far, but that goal-scoring rise makes sense when we see the change in scoring chances over the last decade.
Here is the kicker. We might assume that such an explosion in playmaking over the last 10 years might result in an explosion in transition work. It would stand to reason that if defencemen saw close to a 30% increase in primary shot assists, we’d see a sharp rise in zone entries, right? Not quite:
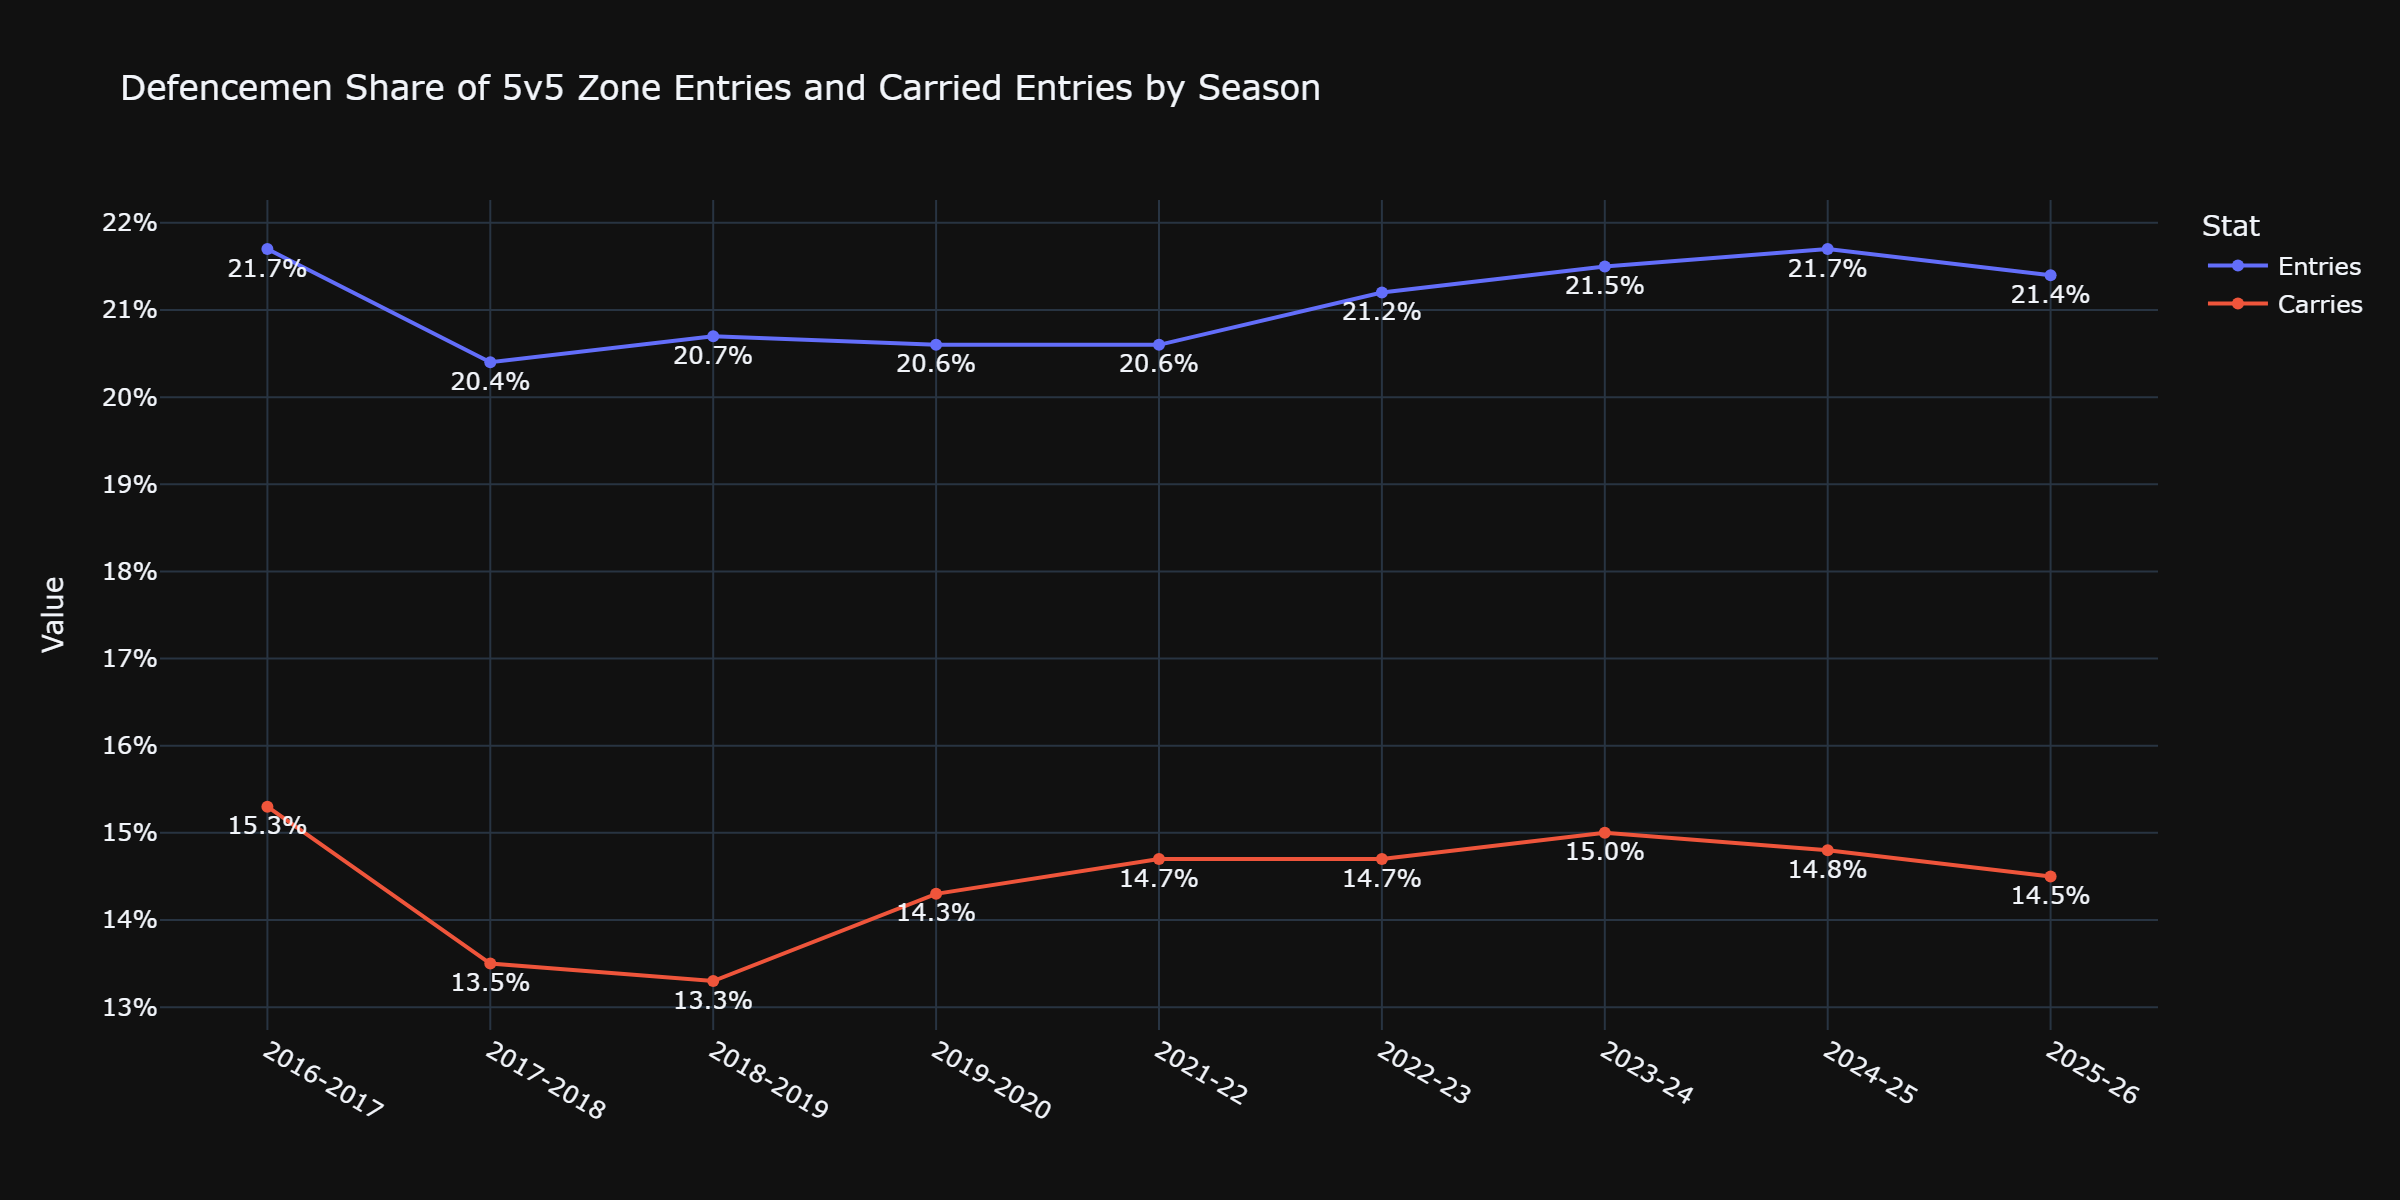
There has been an increase over the last 6-7 years, but it has not been close to the rise in primary shot assists. If we take the largest discrepancy in carried zone entries – 15% in 2023-24 compared to 13.3% in 2018-19 – that relative improvement is less than half the leap in primary shot assists. The increase does matter, but there are other things going on, like being more selective when your team has the puck and/or getting more involved in the cycle after someone else has carried the puck in.
In fact, that has been the case for assists off the rush and assists off the cycle/forecheck. We only have data for those areas from the last five seasons, but in the four years from 2021-2025, the rate of assists from defencemen off the rush exceeded the rate of assists from defencemen off the forecheck/cycle in three of them. Then, in this past 2025-26 season, the rate of assists off the forecheck/cycle exploded:
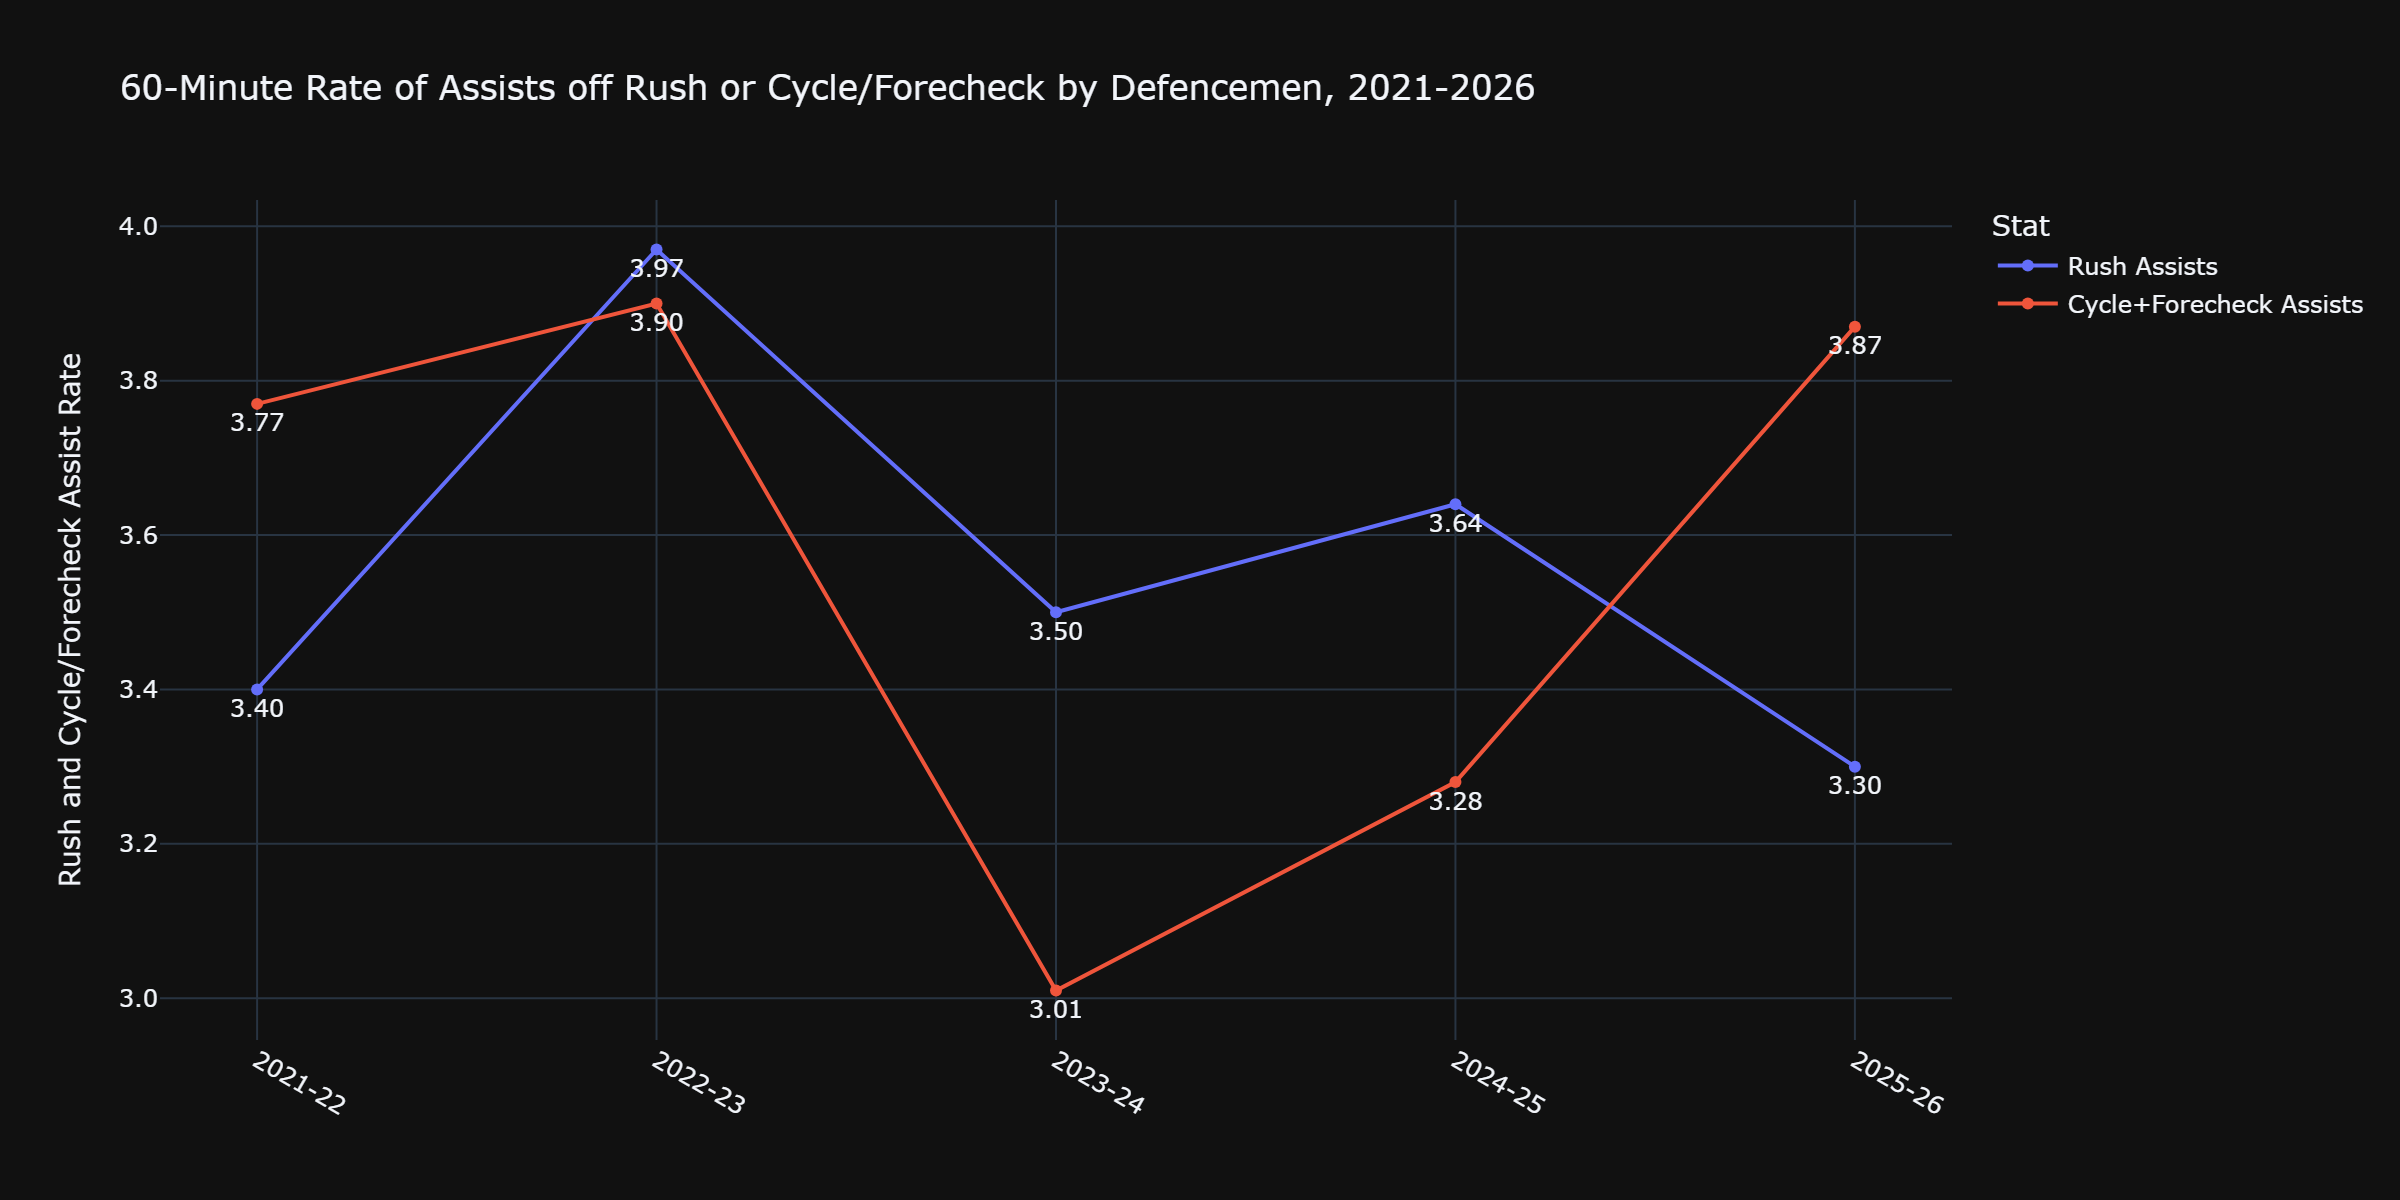
It was a unique season as the league has been moving away from rush offence, but the Stanley Cup-winning Carolina Hurricanes moved towards more rush offence. Regardless, the share of zone entries by defencemen hasn’t exploded to the level of the assists, but they are getting much more involved in the playmaking off the cycle/forecheck, and that helps explain the growing gap we saw between primary shot assists and zone entries this past season.
Staying with transition play, there is one final note here. We have reviewed the huge increase in playmaking and the solid increase in zone entry work, but players can’t be everywhere at once. Knowing all this, maybe it isn’t a big surprise that defencemen have gone from being responsible for half their team’s zone exits to roughly 42% in each of the last four years:
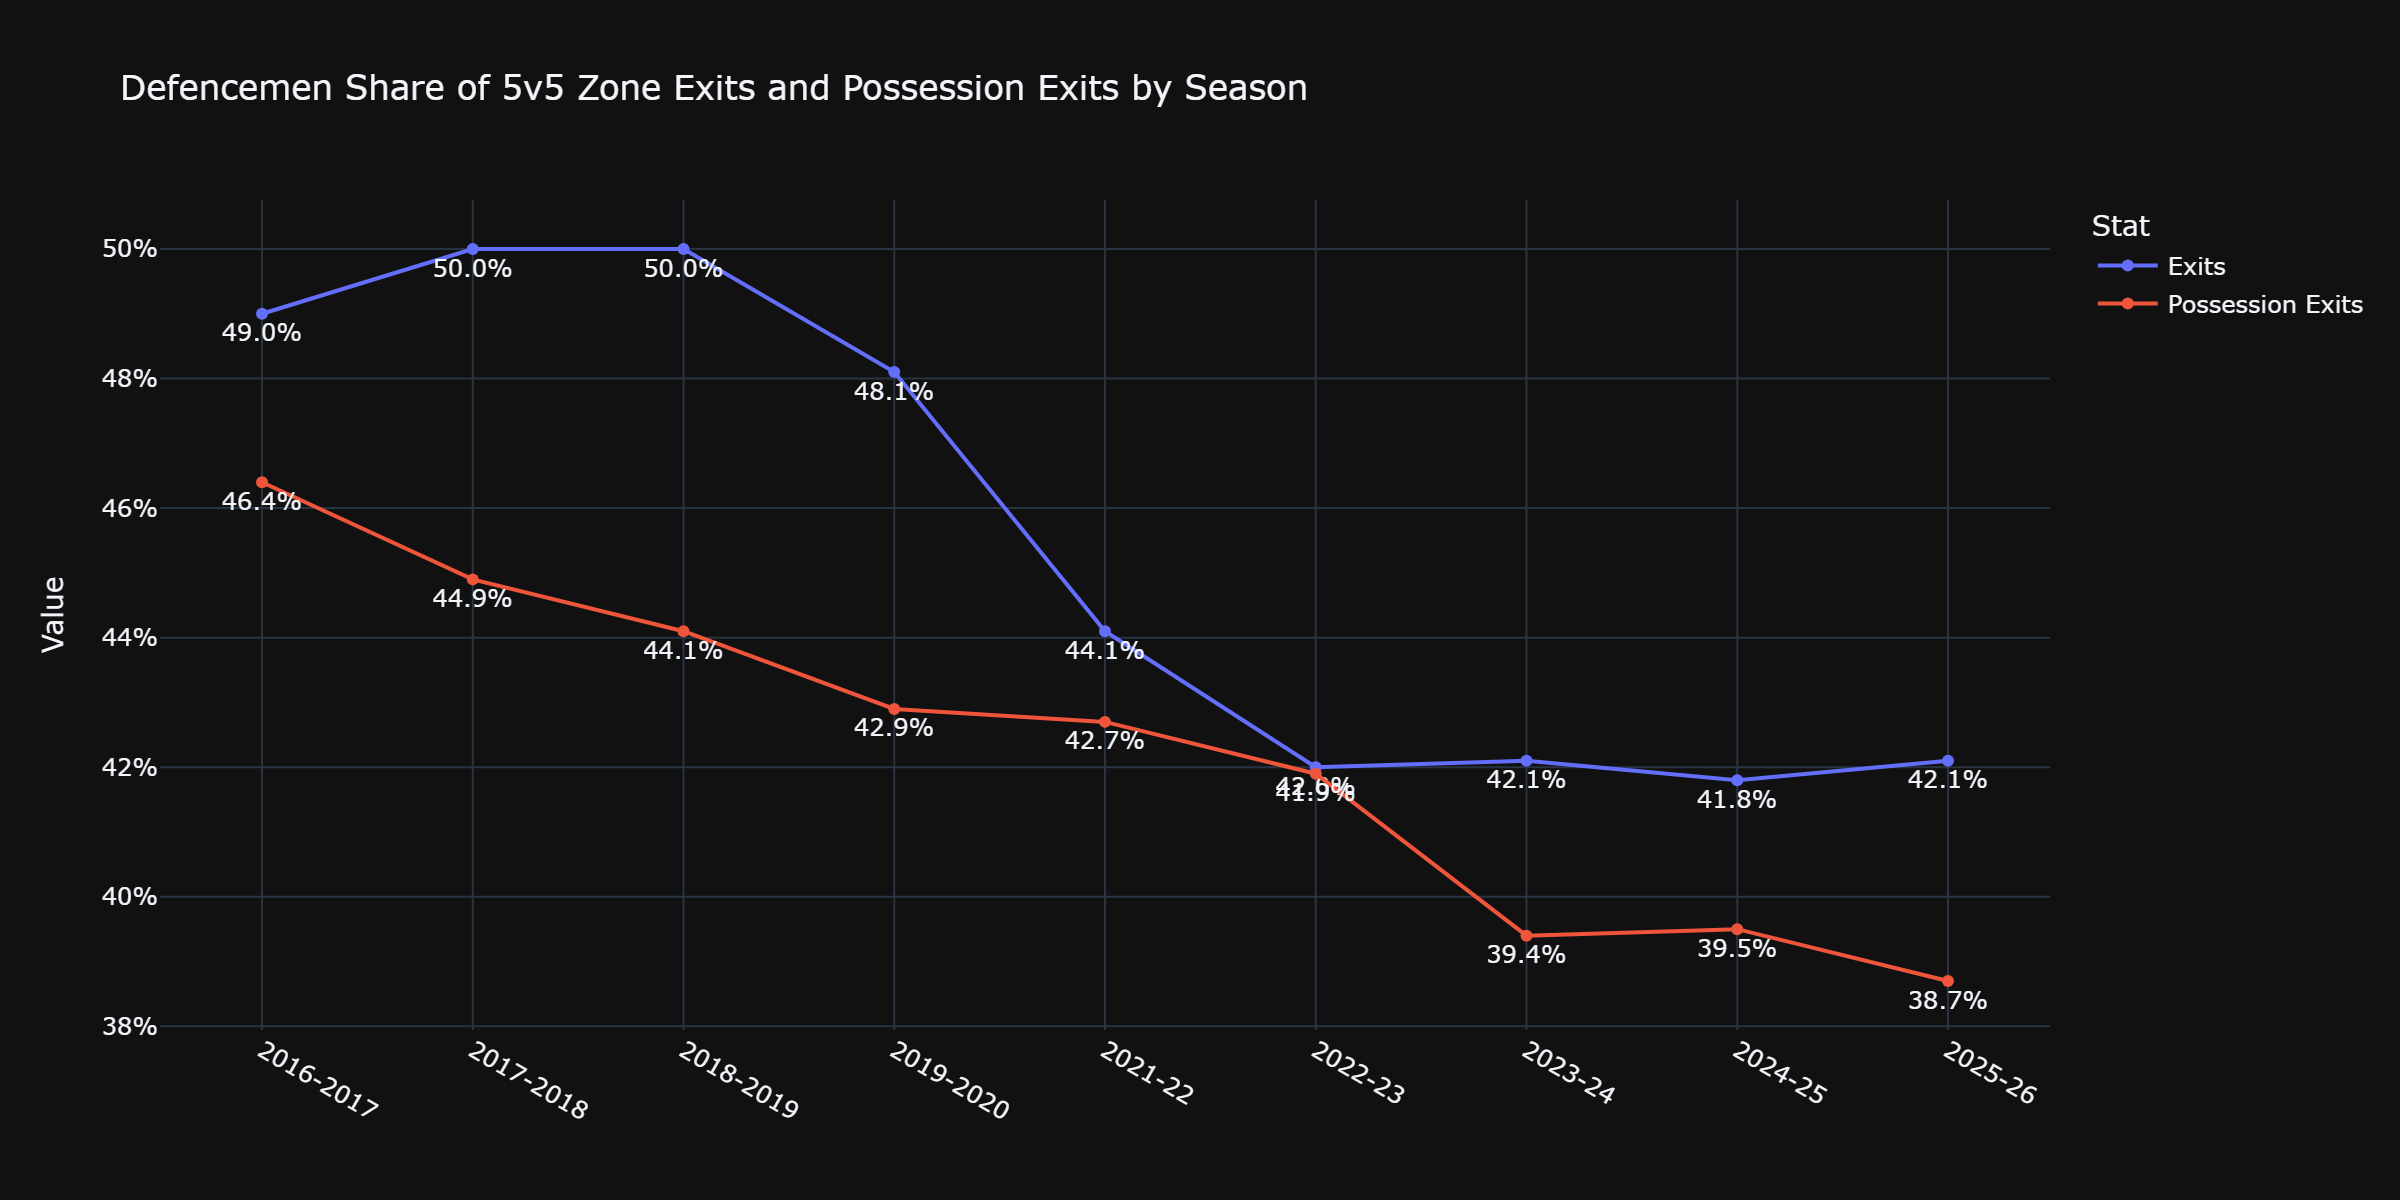
What might be surprising is that the percentage of zone exits with possession keeps dropping even as the percentage of all zone exits has stabilized. Blue liners are helping their forwards more in the offensive zone with each passing season (pun 100% intended), but the help is being reciprocated in the defensive zone. We aren’t anywhere close to what might be called ‘Positionless Hockey’, but we are marching towards it with each passing season.
The nature of both positions has been changing. Coaches always wanted their forwards to help in the defensive zone, but defencemen weren’t responsible for nearly as much offence as they have been in recent seasons. Just think of the 2025-26 Stanley Cup Playoffs. The final four teams were the Colorado Avalanche, Vegas Golden Knights, Carolina Hurricanes, and Montreal Canadiens. Of those four teams, Vegas was the only one that didn’t have a very active blue line, but when you dig into their tracking data, there weren’t many areas where they were flat-out bad. For the most part, the bottom of their tracking data didn’t fall below 10% worse than league average, and they were somewhere between a pair of other playoff teams:
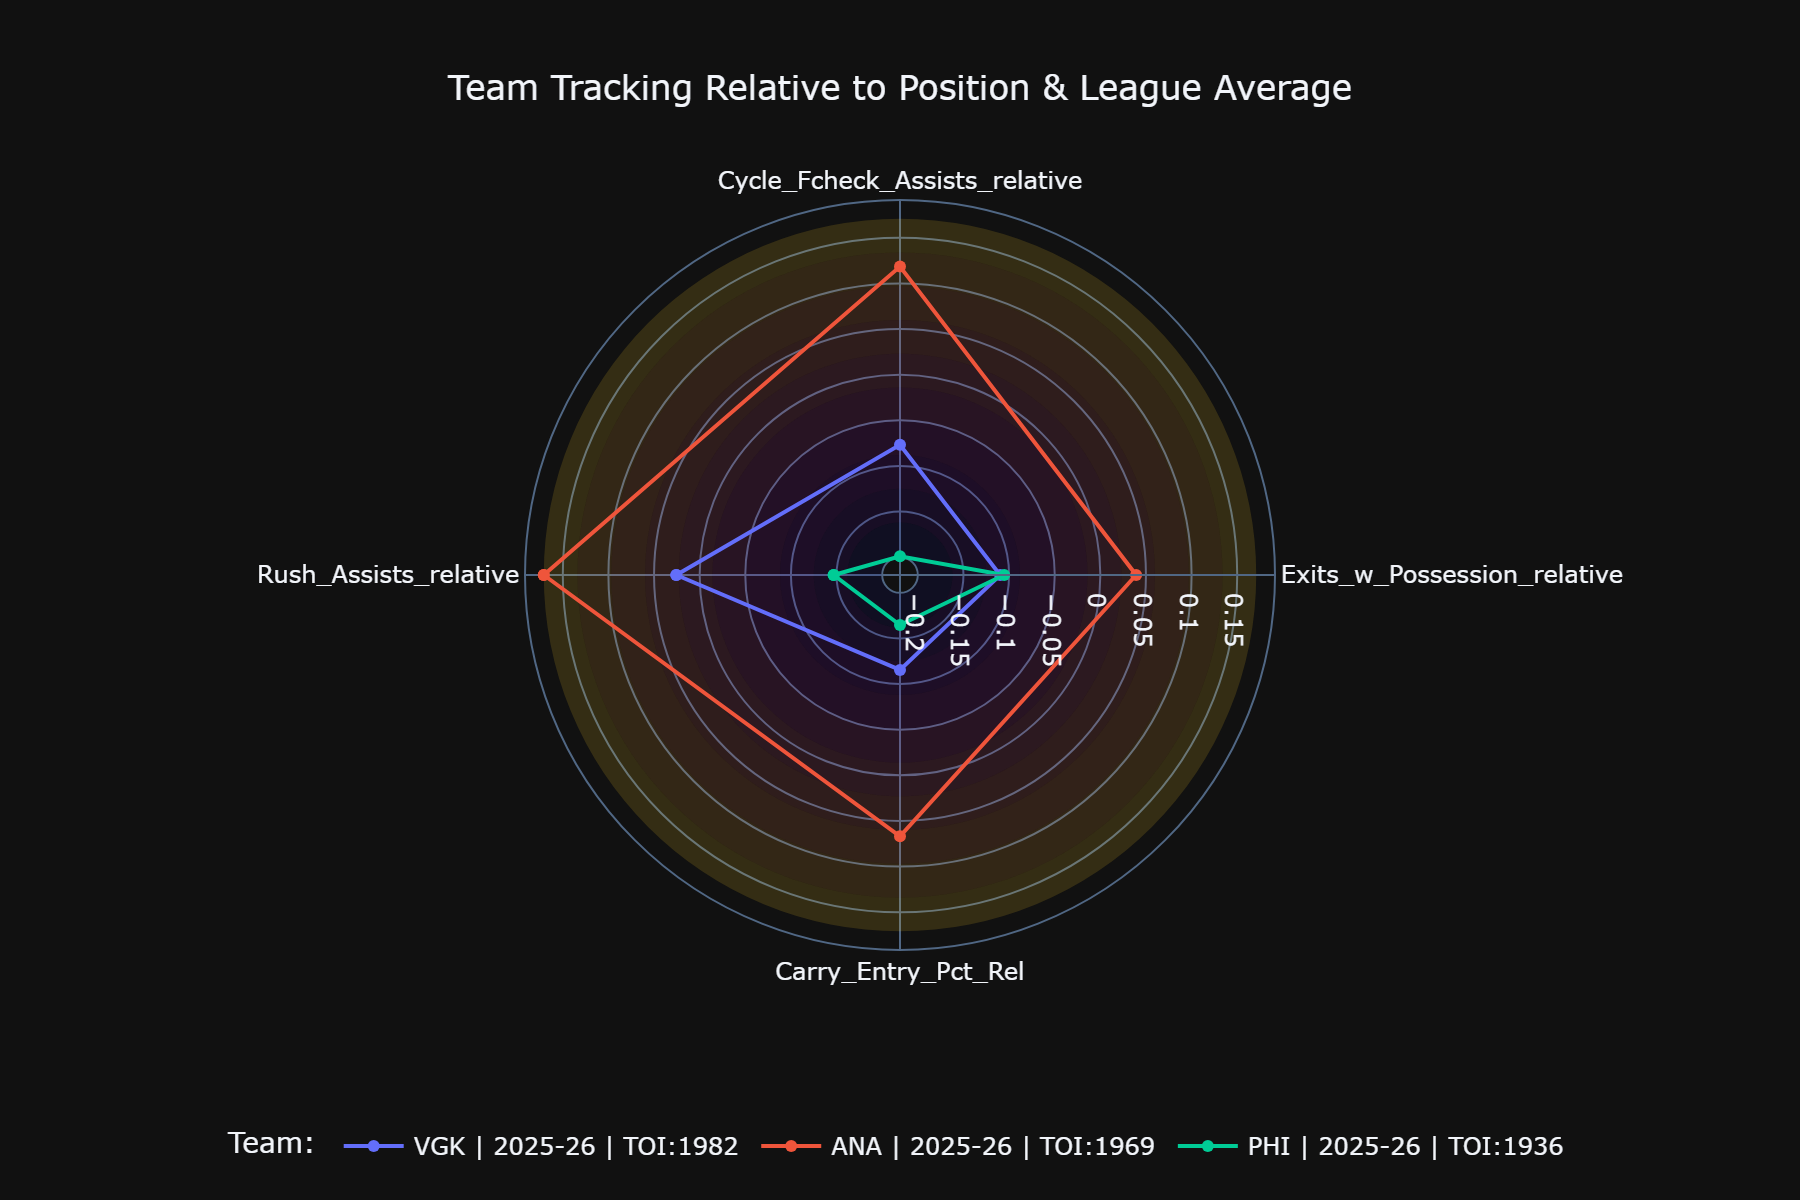
That is what our big takeaway for today should be. While defencemen have been getting more involved offensively as the years go by, it isn’t necessary for each defenceman on a team’s blue line to be Zach Werenski or Erik Karlsson. They just can’t be Simon Benoit or Erik Gudbranson.
Next week, we’ll dig into just how much the increased offensive involvement from defencemen is helping or hurting their teams.
Until then.