Evolution of the NHL Defenceman - Part 1
Beginning a multi-series overview of how NHL defencemen have undergone significant changes to their playstyle.

As with any professional sport, the NHL is constantly evolving. Everything from how teams break out of their zone, to how (and where) they pass the puck in the offensive zone, to what kinds of shots they take, and on the list goes. The NHL in 2026 does not resemble what it was in 2006.
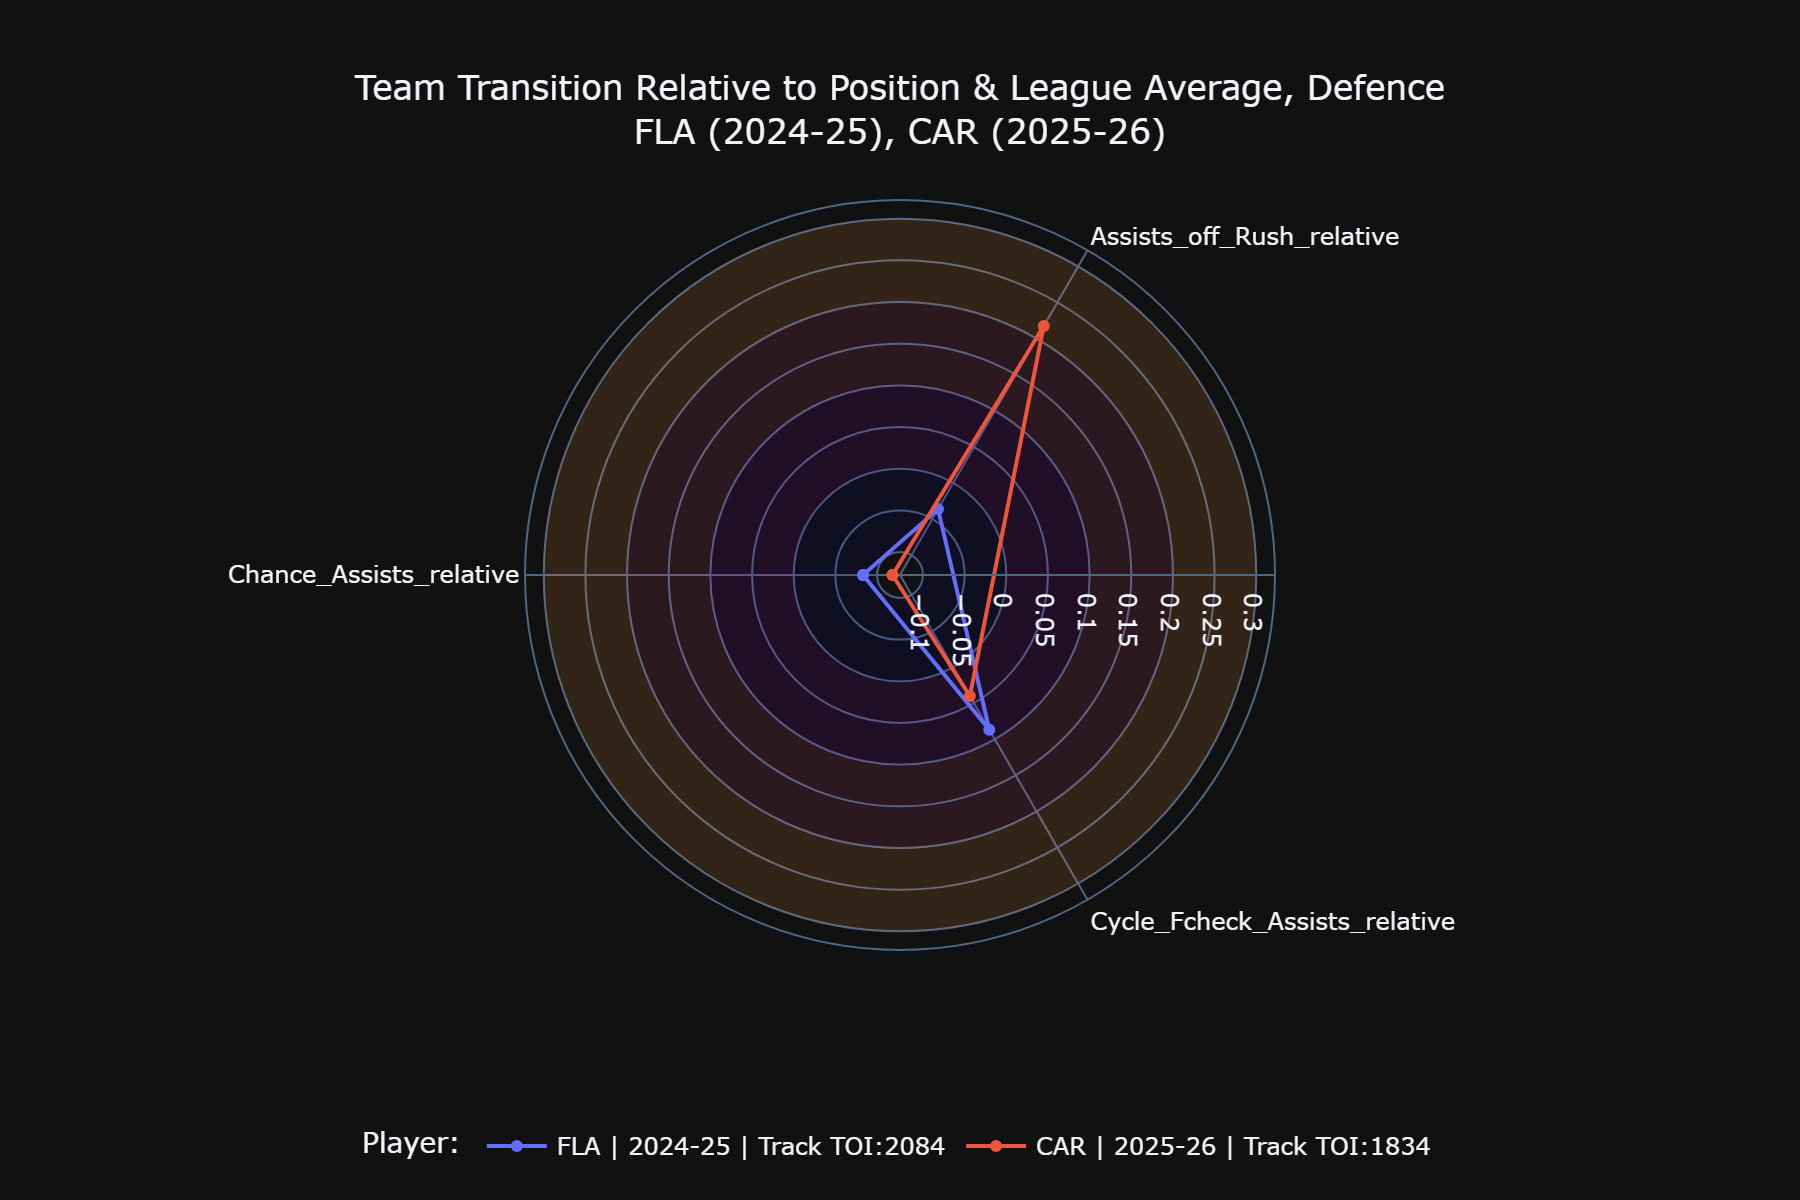
This evolution is especially true for defencemen. If this were 20 years ago, bruising, stay-at-home blue liners would be commonplace, while the elusive, puck-moving defencemen would be a rarity. That script has flipped and it has not been more apparent than most of the recent Stanley Cup winners. Whether looking at the Carolina Hurricanes, Florida Panthers, or Colorado Avalanche, nearly their entire defence groups were capable of not only making the first pass out of the defensive zone, but of being part of neutral zone transition play, the rush, or the cycle. It isn’t conjecture, either, as the defencemen from the 2024-25 Panthers were nearly 10% above league average, as a group, by assists off the cycle/forecheck, and the defencemen from the 2025-26 Hurricanes were over 20% above league average by assists off the rush:
The modern NHL defenceman is tasked with a lot more than just making the first pass.
To highlight the changes, this series will review several areas where we’ve seen changes on the blue line. We will start at the beginning of the Analytics Era, or the 2007-2008 season, and move all the way up to today. This is going to be a series of articles demonstrating how much the position has developed and when the major changes occurred.
The series begins with the basic stats: goals, assists, and shot attempts. This will include delineating between 5-on-5, the power play, and at all strengths. Data is from Evolving Hockey.
If we want to highlight how defencemen got more involved in the offence, the simplest way is showing the percentage of all goals and shot attempts belonging to defencemen. One feeds into the other, but there was an increase in the percentage of all shot attempts belonging to defenders in 2010-11 that kept rising each season until 2017-18, at which point it sustained a consistent level for three more years:
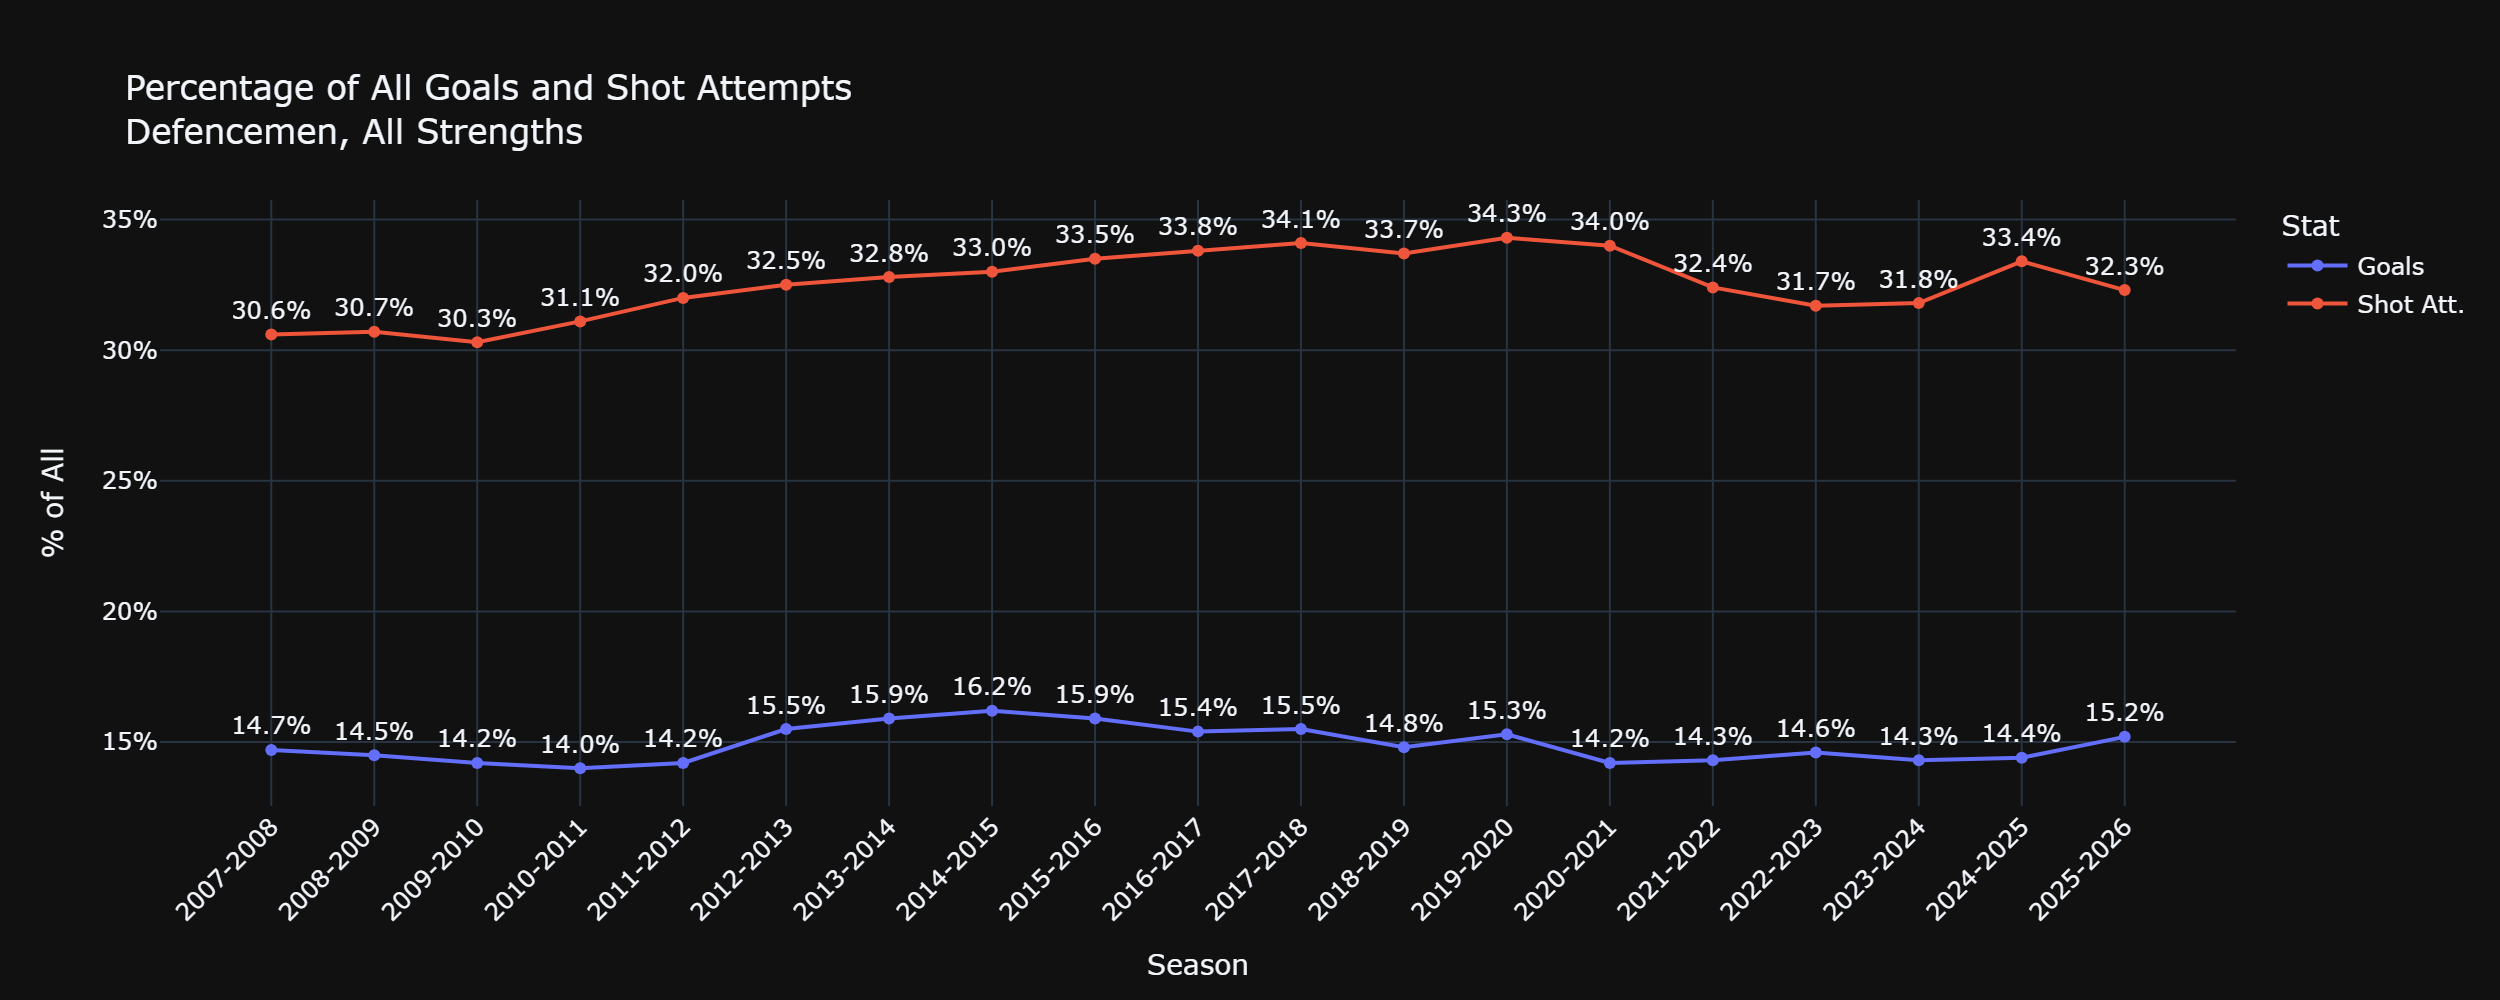
In 2009-2010, we have the lowest point on the shot attempt portion of the chart with defencemen accounting for just 30.3% of all shot attempts. A decade later, the 2019-20 season saw them taking 34.3% of all shot attempts. For a frame of reference, this past 2025-26 campaign saw 152 921 shot attempts taken by all skaters. If defencemen had accounted for 30.3% of those attempts, they would have been responsible for 46 335 attempts. If they had accounted for 34.3% of attempts, they would have totaled 52 452 shot attempts, or an extra 19 shot attempts for every defenceman that appeared in 2025-26 season. That is a huge change over the course of a decade and helps to underscore their increased offensive involvement.
The other portion of that chart is the goal scoring. Goals lagged shot attempts as the latter saw increases from 2009-10 through 2011-12 while the former stayed consistent in that same timeframe. It wasn’t until the lockout-shortened 2012-13 season that the percentage of all goals scored by defencemen pushed past 15%, and then it stayed between 15-16% for six of the next seven seasons.
We are at the point where we have to discuss the power play. It is now commonplace, so it’s easy to forget that teams often ran power play units consisting of three forwards and two defencemen up until the 2010s: In 2007-08, there were 52 different defence duos with at least 50 minutes of power play time together, but a decade later, there were just 19 such defence pairs. That change in power-play usage becomes obvious when we see their percentages of shot attempts both at 5-on-5 and on the power play over the years:
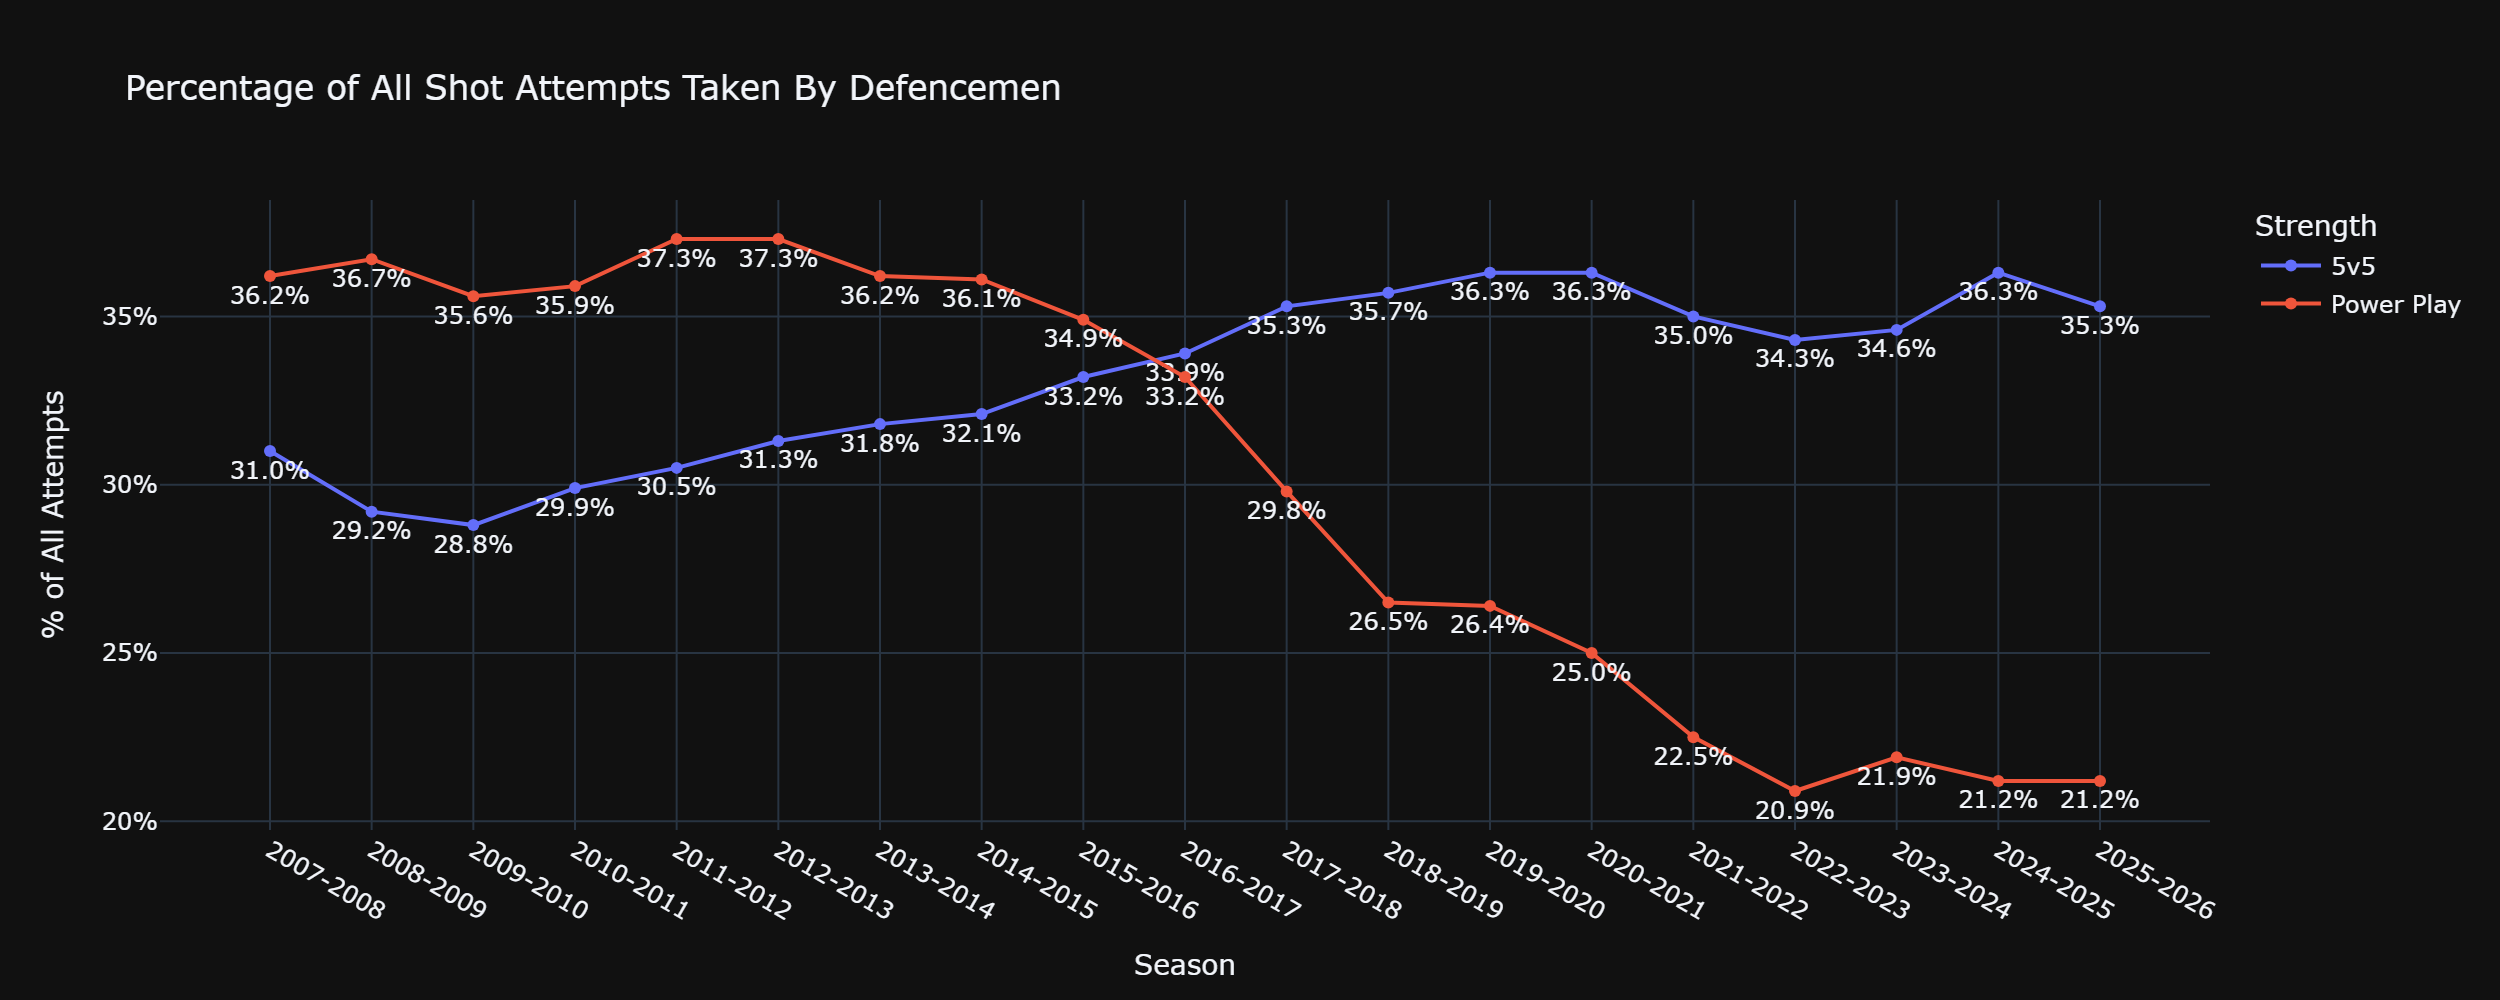
In the early 2010s, defencemen were taking over 37% of all the shot attempts on the power play. From that point for the next 11 years, there was a decline every season, before bottoming out at 20.9% of power-play shot attempts in 2022-23, and the rate has stayed around the 21-22% mark for the last four years. The decline in PP shot attempts is easily explained by teams moving to four forward/one defenceman PP units. Fewer defencemen on the power play meant fewer shot attempts taken by defencemen.
On the flipside, there was a dramatic rise in shot attempts taken by blue liners at 5-on-5, beginning from a low of 28.8% in 2009-2010 and, 10 years later, getting up to 36.3% in 2019-20. There has been some bouncing around in recent seasons, but even the low point of the last five years (34.3% in 2022-23) is higher than any single season between 2007-2017. It has now been nine straight seasons of defencemen being responsible for more than 34% of the shot attempts at 5-on-5 after 10 straight seasons of being below 34%. The flattening of shot attempts in the mid-2010s we saw earlier when looking at all-strengths play is not an accurate representation of how much these players were getting involved offensively. This is the first clear indicator of blue liners becoming increasingly vital to their team’s offence.
The second indicator is the assist rate. Aside from the lockout-shortened 2012-2013 season, the percentage of power-play assists belonging to defencemen exceeded 33% for each season from 2007-08 through 2015-16:
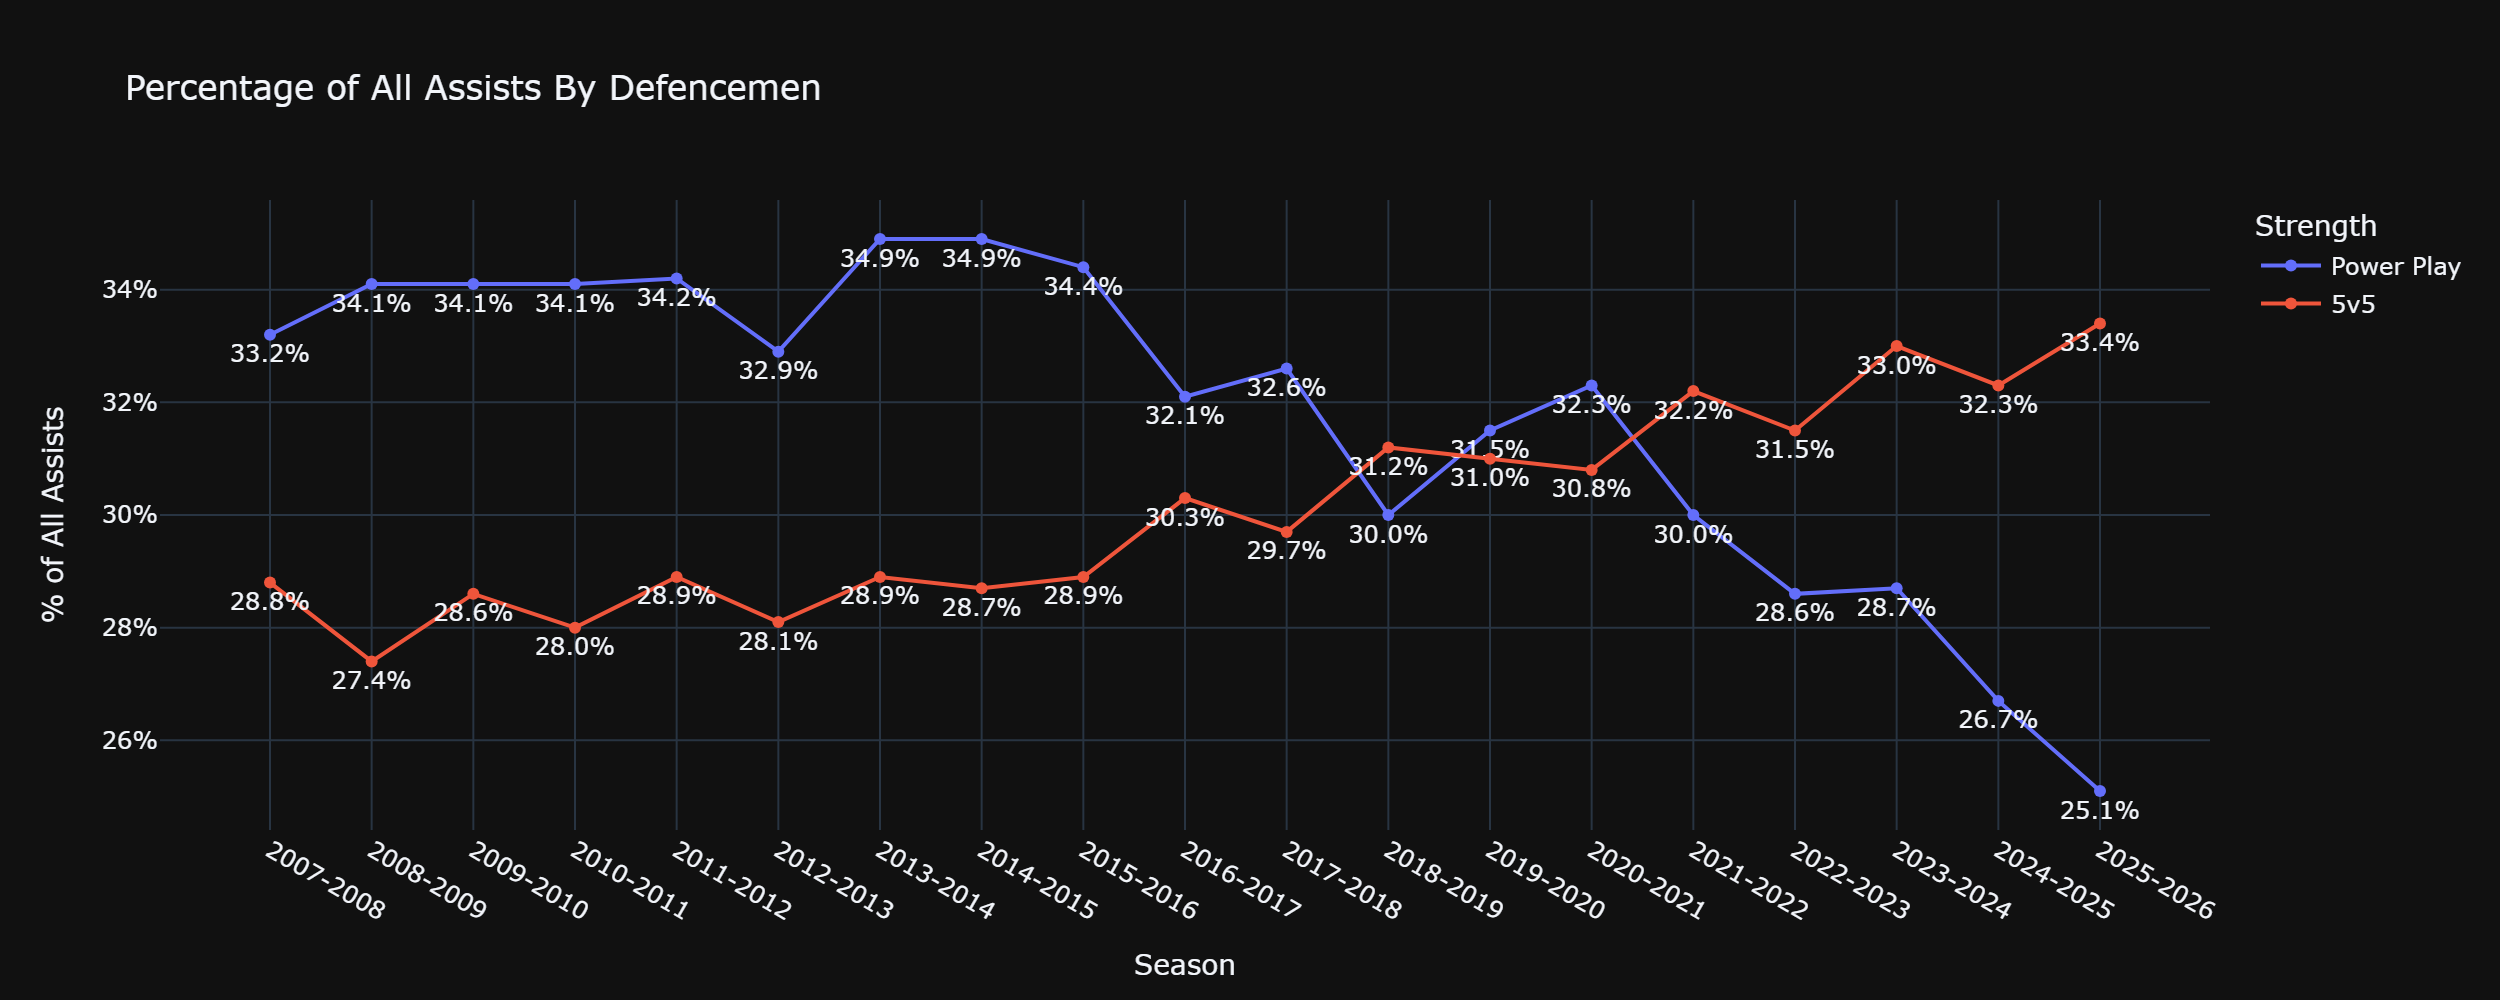
That 33% level has not been reached since, and it has been under 30% for four consecutive seasons.
Again, fewer defencemen on the power play leading to fewer assists is not a surprise, and it also doesn’t reflect what was happening at 5-on-5. There have frequently been season-to-season fluctuations, but since 2012-13, there has been a steady rise of 5-on-5 assists produced by defencemen. In fact, from 2007 through 2016, there was not a single season where defencemen were responsible for at least 30% of assists at 5-on-5. That trend has completely reversed as we have now seen eight straight campaigns where blue liners accumulated at least 30% of the assists at 5-on-5, and it has been above 32% in four of the last five years.
It is important to separate play by strengths. If we looked at our first graph, the percentage of shot attempts at all strengths was relatively consistent from 2014 through 2021. However, those seasons saw a consistent rise in shot attempts from defencemen at 5-on-5, paired with a consistent decline in shot attempts from defencemen on the power play, a lot of that thanks to simply moving from the 3F/2D power play. Rearguards were getting more involved offensively, they just needed to be on the ice to do it.
Until next time.