Evolution of the NHL Defenceman - Part 9
Power play efficiency has been a hallmark of this era of the NHL. Defencemen have reaped the rewards, but there's more to their power play involvement than just production.
To this point of the series, there has not been much discussion of the power play. In Part 1 and Part 2, we contrasted power plays to 5-on-5 situations in terms of goals, assists, and shots from defencemen. That was done to highlight how the changes at 5-on-5 showed the true nature of increased offensive participation from the blue line.
Today, we will focus exclusively on the power play. This will cover everything from changes in ice time, to production, to the tracking data. We are using standard player data from Evolving Hockey and tracking data from All Three Zones. This is all at 5-on-4 as well, so we’re excluding 5-on-3 and 4-on-3 power-play situations.
Ice Time Changes
Starting in 2007-08 and going right until this past season, and as noted in those first two parts of this series, there was a sharp decline in the percentage of power play goals, assists, and shots belonging to defencemen in the mid-2010s, and that persisted until the start of this decade. Things have stabilized over the last five years, but the movement from 3-forward/2-defenceman PP units had a substantial impact on the amount of PPTOI available to blue liners. In fact, in the 15 years between 2010 and 2025, defencemen lost about one-third of the available ice time:
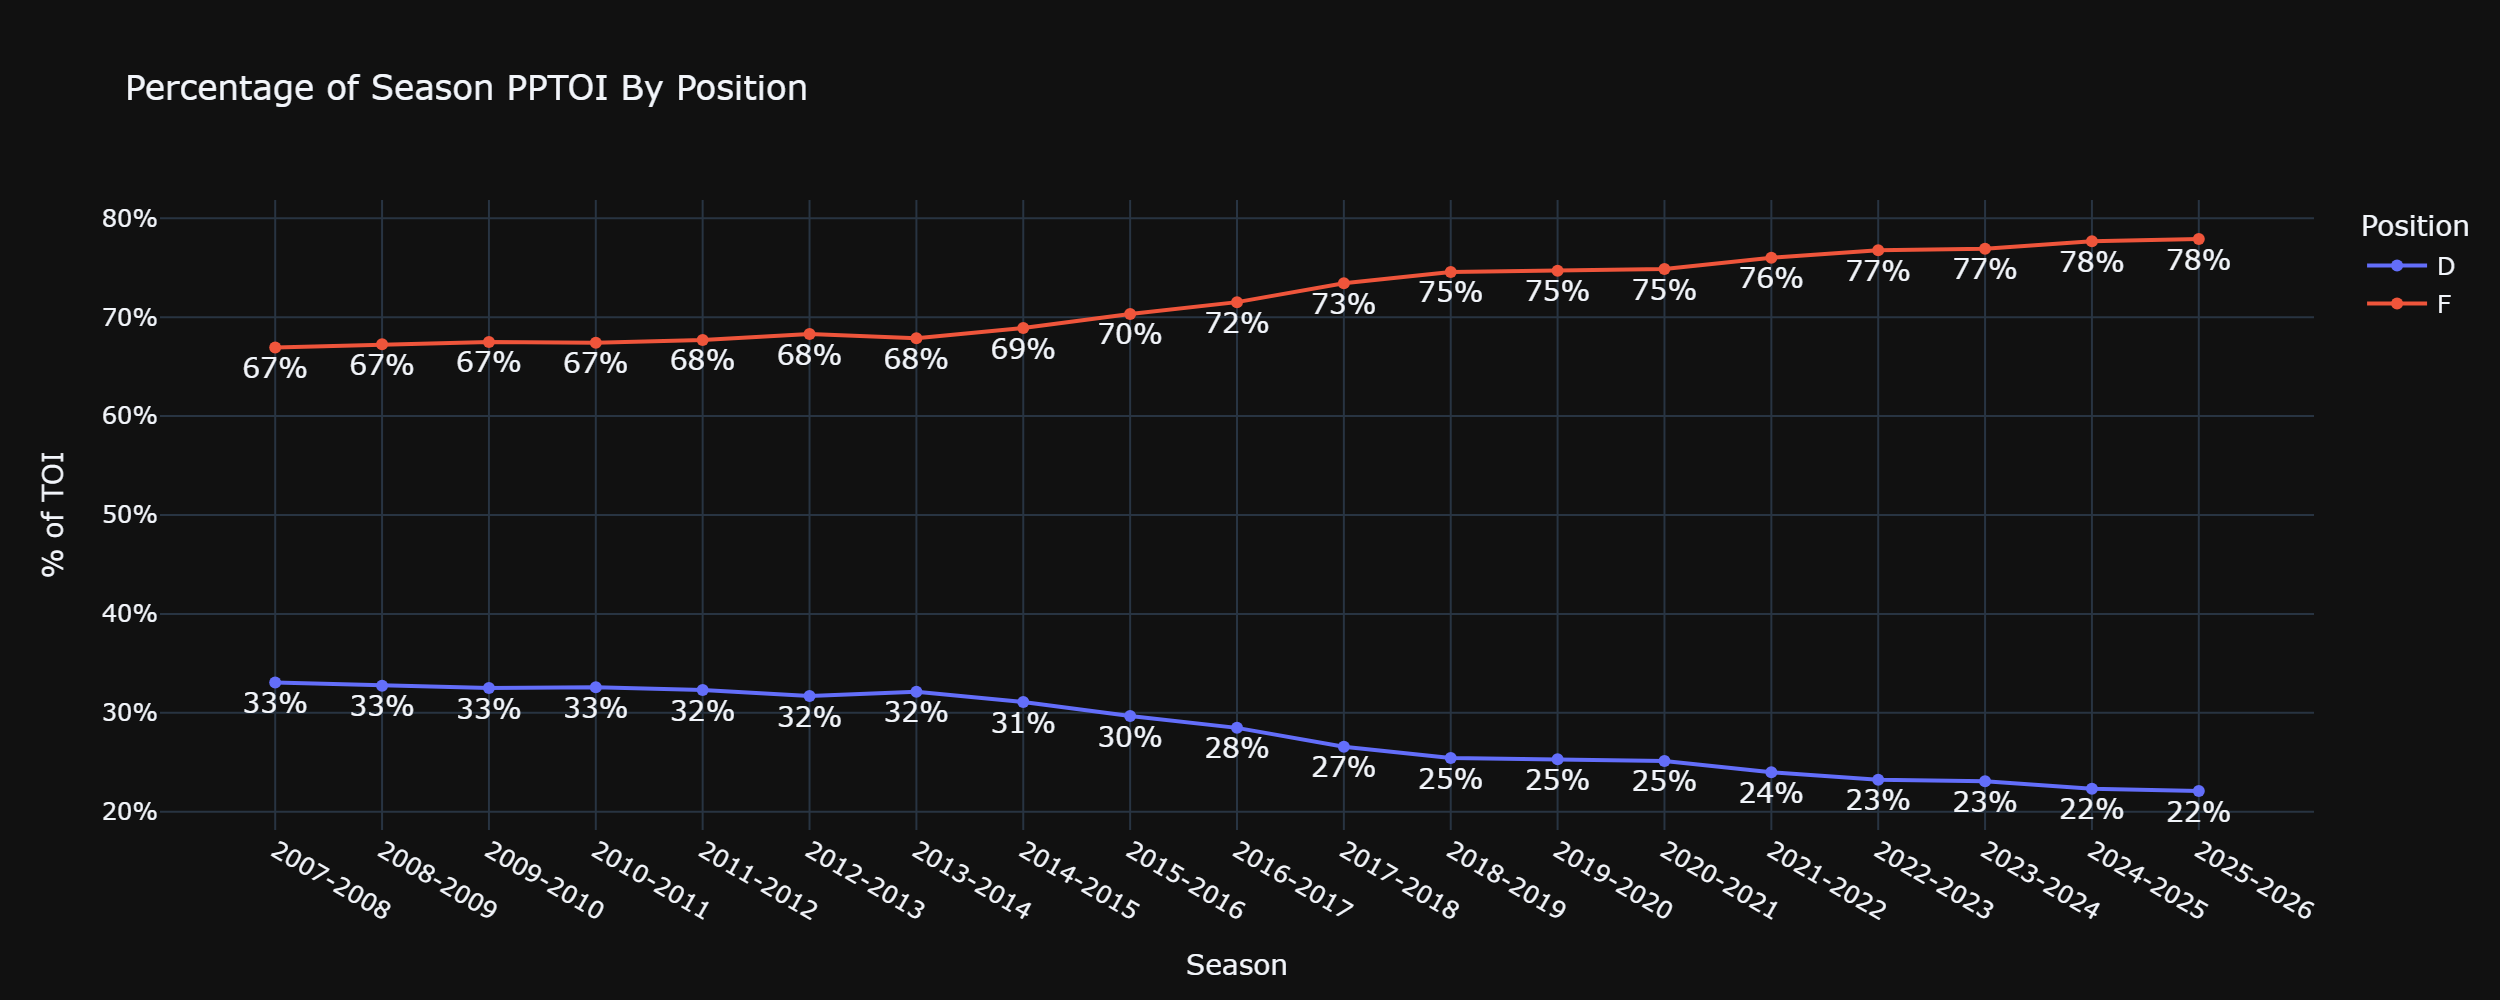
The decline in ice time led to the decline in goals, assists, and shots. That is all straightforward.
That isn’t the only change, though. Power-play quarterbacks are something every team wants but true quarterbacks aren’t abundant. Rather than looking at overall ice time, let’s look at the share of a team’s PPTOI where a specific defenceman is featured. If we take our seasons from 2007-2026 and create three groups – from 2007-2014, from 2014-2020, and 2020-present – and include only the PPTOI shares that are in the top standard deviation, or roughly the top 16% of PPTOI shares from individual defencemen in a season, we see a different trend:
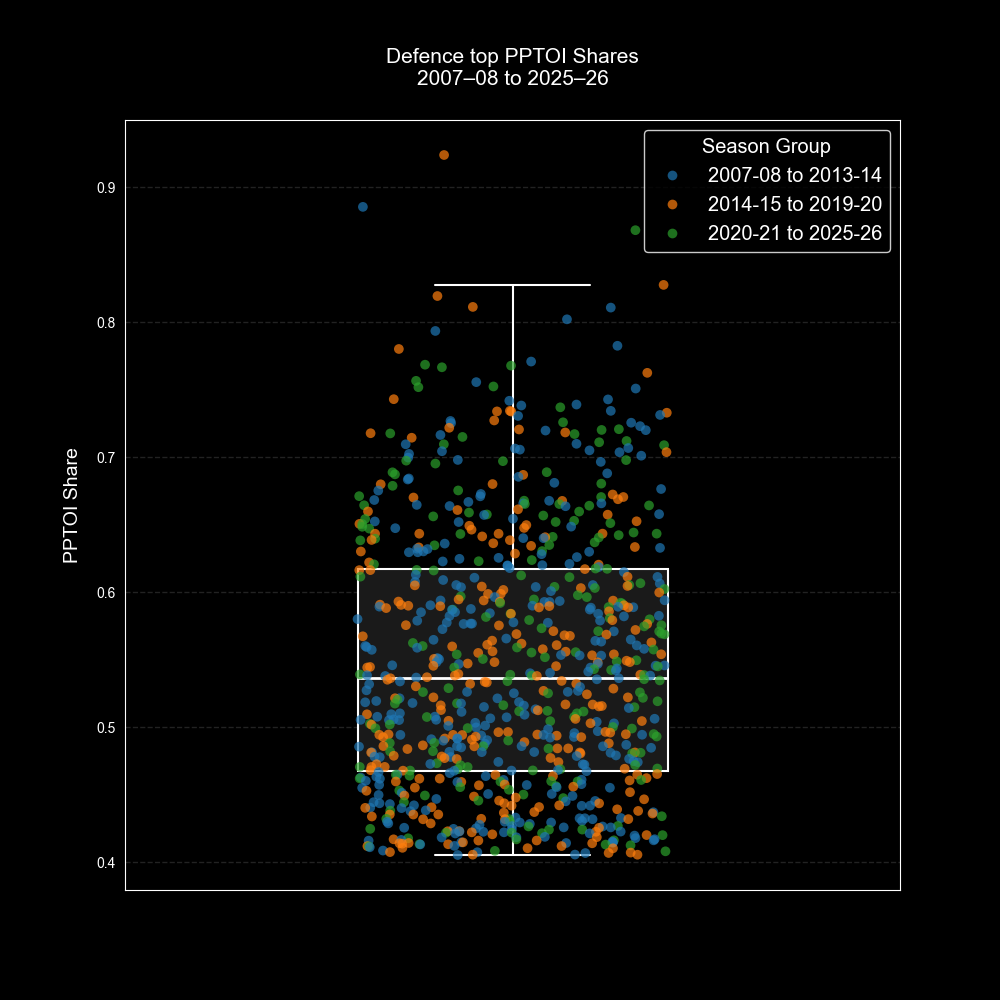
The green dots are the defencemen PPTOI shares in any season from 2020-2026. Only one green dot is above the 80% threshold, and it was Evan Bouchard in 2025-26. There wasn’t a defenceman who reached that mark in 2019-20, either, so that means we had six straight years without a defenceman getting 80% of their team’s PPTOI. There were more defencemen to cross the 80% mark in the 2014-15 season alone (2) than in the last seven seasons combined.
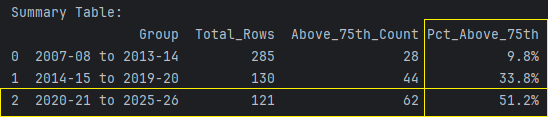
However, just because we don’t have the PPQB workhorses we used to, it doesn’t mean there aren’t still a lot of defencemen getting heavy usage. That has been another change. To be in the top 25% of PPTOI share from the blue line since 2007, a defenceman needed to earn roughly 61.7% of their team’s power-play ice time. Of all the dots on our chart, here are the percentages of our groups to be above that threshold:
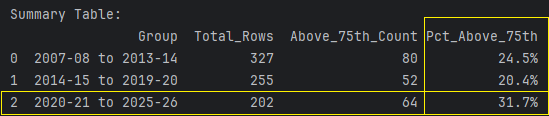
In the seasons from 2014-2020, just 20.4% of our top PP defencemen crossed our threshold. In the seasons since then, that number is a whopping 31.7%. Maybe we don’t have our workhorse PPQBs anymore, but there are far more heavy-usage PPQBs now, at least by share of their team’s PPTOI.
*Note: Defencemen PPTOI shares are the percentage of PPTOI from all their team’s PP ice time. If a player plays just 70/82 games, there are as many as 12 games where they are missing out on ice time. Quinn Hughes has crossed the 80% threshold in games he appeared each of the last two seasons, but because of time missed, he fell short when looking at the total available ice time. However, even if we exclude games missed, there were as many 80% defencemen in 2009-2010 alone (3) than in the last six years combined.
Points and IPP
Power play efficiency started being tracked by the league in the 1963-64 season. In that time, there have been 22 seasons where the league-wide power-play conversion rate was at least 20%. Most of those seasons (15 out of 22, in fact) came between 1974-1990. Of the remaining seven seasons over a 20% conversion rate, five of them have been the last five seasons. Knowing that, it’s not a big surprise that if we do a similar chart like we did for ice time, the stretch from 2020-2026 is well represented by points per 60 minutes on the power play (minimum of 66 PP minutes in a season, which is the average of all our defencemen since 2007):
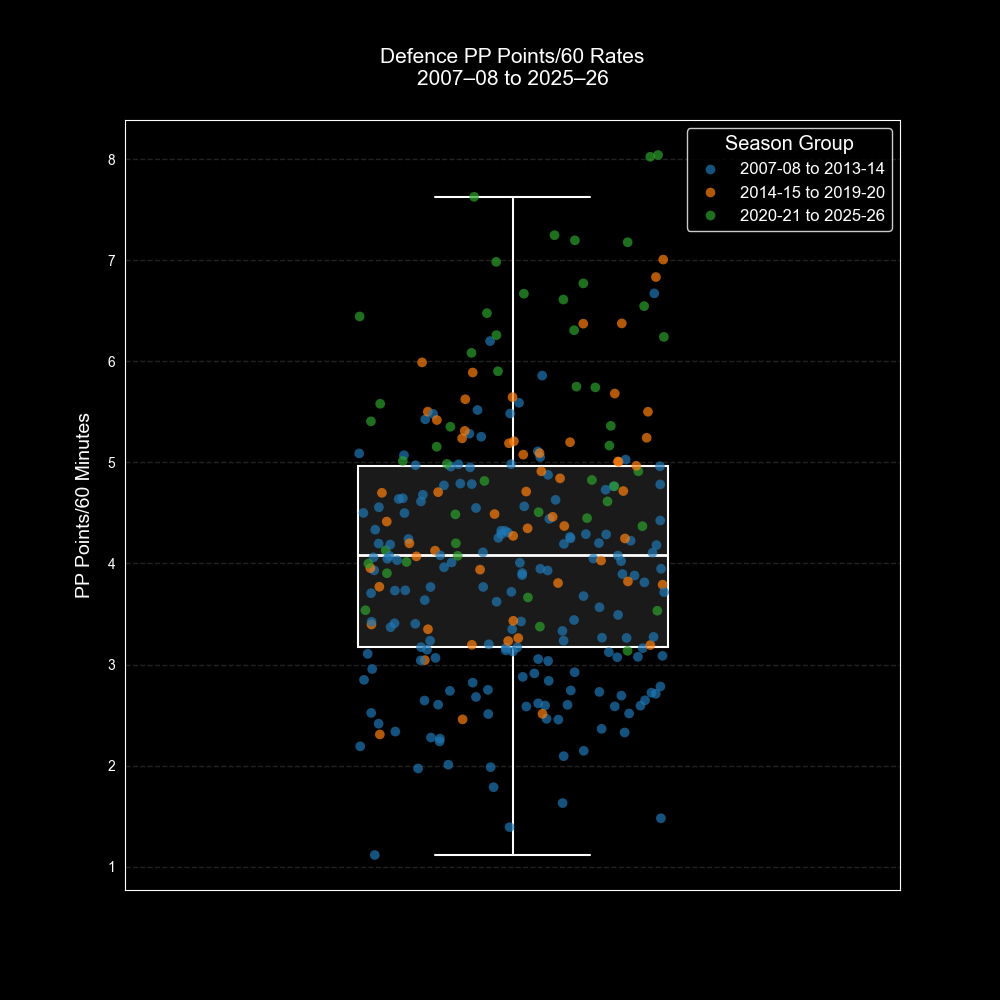
All the green dots are from 2020 until now. To clarify this, let’s take the top ice time totals from this group of 66-minute blue liners and see how many defencemen from each group of seasons exceed 4.97 points per 60 minutes (the top 25% of points producers):
Fifteen years ago, we might expect 1 in 10 heavily-used PP defencemen to approach or surpass 5.0 points per 60 minutes. Now, that number is about 1 in 2. In the 2025-26 season alone, 7 of 12 defencemen who reached the TOI cut-off we used exceeded 5.0 points per 60 minutes, and Rasmus Dahlin wasn’t far behind at 4.9.
A big chunk of that can be explained by improved power-play efficiency, but does it tell the whole story? How often a defenceman garners a point when his team scores a power-play goal matters, too (Individual Points Participation, or IPP). What if we take the same ice-time cut-off of 66 minutes, use the same three groups of seasons, bring back our share of team PP ice time that a defenceman skates, and add how often they get a point when their team scores a PP goal? Here is what that looks like:
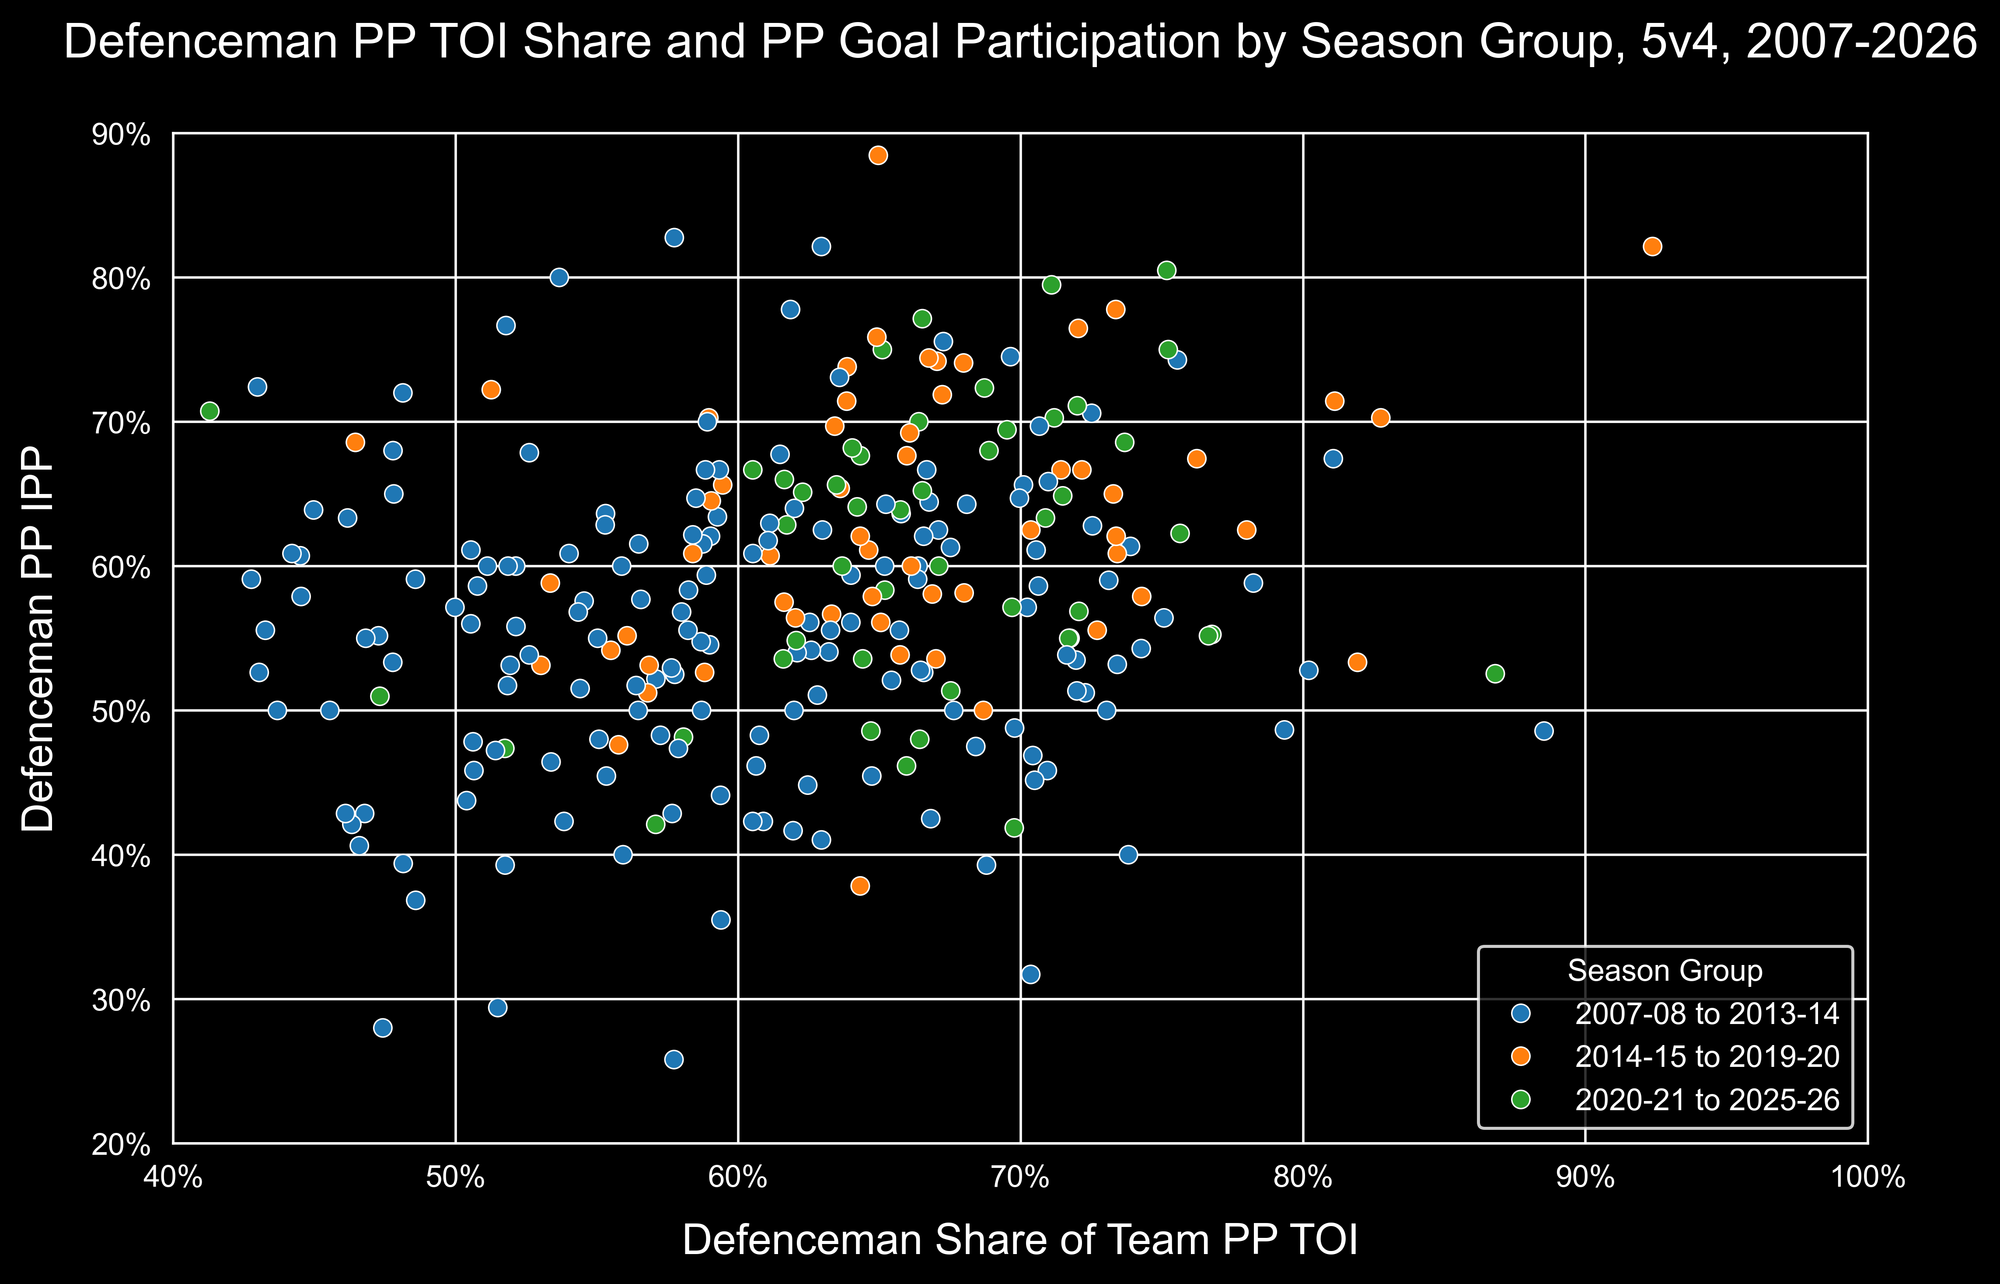
This is a bit more muddled. That becomes crystal clear when we see how often defencemen from each season group exceed the 75th percentile:
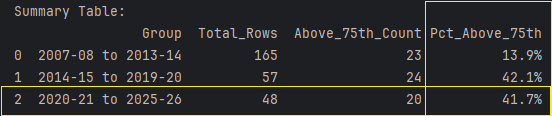
There has been a significant change since the late 2000s/early 2010s but not much has changed over the last 12 years. Remember that we are focusing on heavily-used PP defencemen here, so things will change a bit if we expand the sample, but I’m still a fantasy hockey guy, and the heavily-used PP defencemen are of particular interest to me. These guys aren’t producing more because they’re getting more involved, they’re producing more because teams are converting on the power play much more often than they have at any time in the last 35 years.
Tracking
The last thing I want to touch on is the tracking data. Again, this is from All Three Zones, and the proprietor of that site, Corey Sznajder, only started tracking power-play data in 2017-18 (I excluded the shortened 2021 Bubble season). It won’t be as extensive as we just saw with ice time or production, but there is a bright side: the mid-2010s saw the decline of 2-defencemen PP units, so by the time the tracking data starts, that decline is in full swing.
It is important to keep in mind that while the 2-defenceman setup started a real decline in the mid-2010s, it has been an ongoing process. While the 2021-22 season saw just seven pairs of defencemen skate at least 50 minutes together on the power play, there were 17 pairs of blue liners to reach that mark just four years earlier. As we get fewer defencemen on the ice for the power play, we should see a decline in their share of power-play zone entries since 2017-18, which is what happened right up until 2025-26:
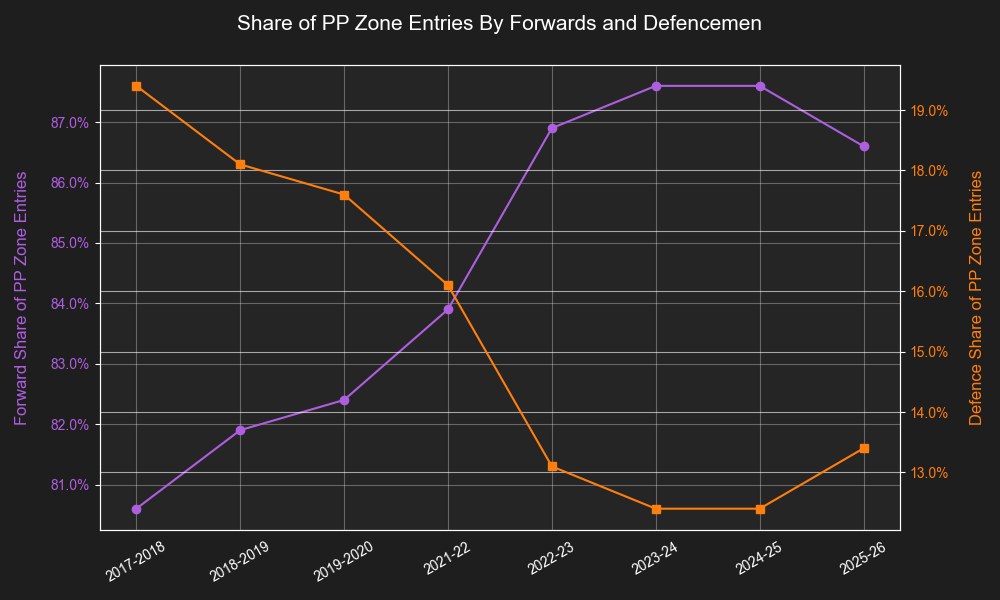
It is interesting to see a slight rebound in 2025-26, and that was true when we look at the share of zone entries carried in:
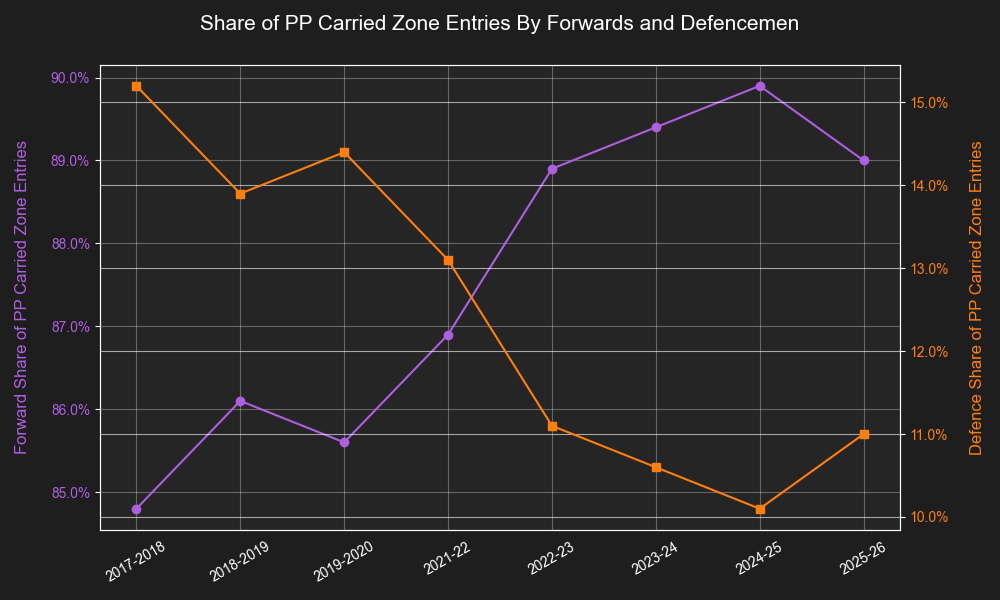
Both PP zone entries and carried zone entries rebounded a bit for defencemen this past season, but one year does not make a trend, so it’s more of a curiousity than anything.
There is a wrinkle, though. If don’t look at the share of all zone entries or carried entries that came from defencemen, and rather looked at league-wide carried zone entry percentage (the percentage of zone entries that are carried in), we see something else emerge:
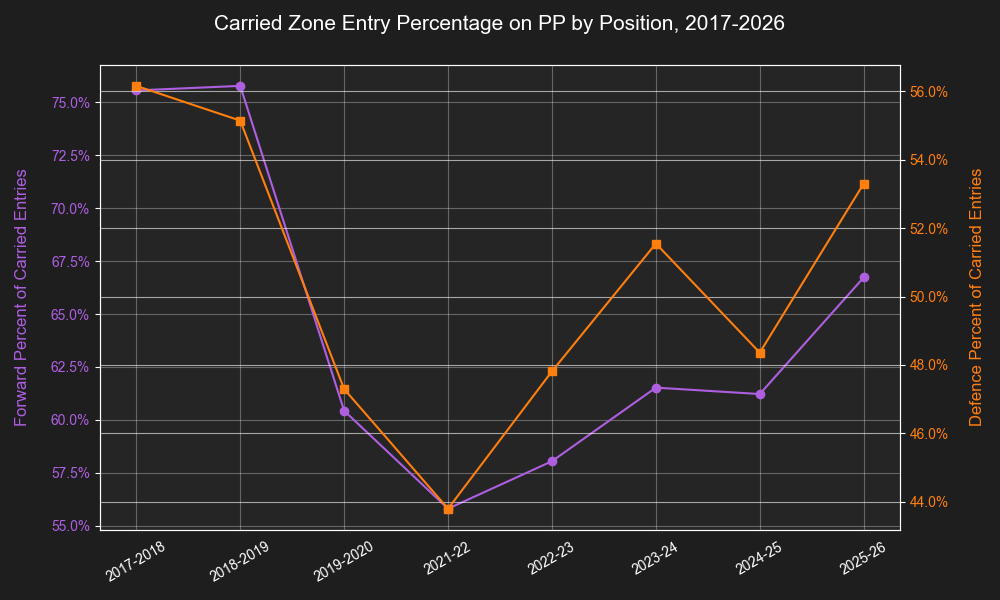
Forwards and defencemen have followed the same path of declining carried entry percentage from 2019-2022 with a steady rise since. The difference is that defencemen have increased even faster than forwards: in 2025-26, defencemen increased their carried zone entry percentage by 22% relative to the 2021-22 season whereas forwards increased theirs by 19.5%. It isn’t a massive chasm, but it is notable that teams are leaning a bit more on their blue liners to carry the puck in, even as both positions have improved markedly over the last four years.
The biggest impact for improved PP point production for defencemen has just been due to teams significantly improving their efficiency over the last decade. On the other hand, that statement overlooks the fact that more defencemen are secure in a top PP role than they were 10 years ago, and that they’re being relied upon to get the puck into the offensive zone with control much more than they were five years ago.