Evolution of the NHL Defenceman - Part 2
Goal scoring from defencemen keeps rising but there is more to that story.
In Part 1 of this series, we directed our attention to changes in shot attempts and assists by defencemen, looking first at all strengths, but then separating by 5-on-5 and the power play. The focus began with attempts and assists because they lead to a more important event: goal scoring. Shot attempts lead to shots on goal, which turn into goals, while assists are definitionally attached to goals. Scoring more than the opponent is the whole point of the game, so we start with the base, and build our way up.
Using data from Evolving Hockey, Part 2 of the series will focus on changes to shots on goal and goal scoring by defencemen.
As a quick refresher, the first article quickly touched on how the percentage of goals scored by blue liners started rising during the lockout-shortened 2012-13 season, but that was a couple of seasons after we started seeing an increase in shot attempts:
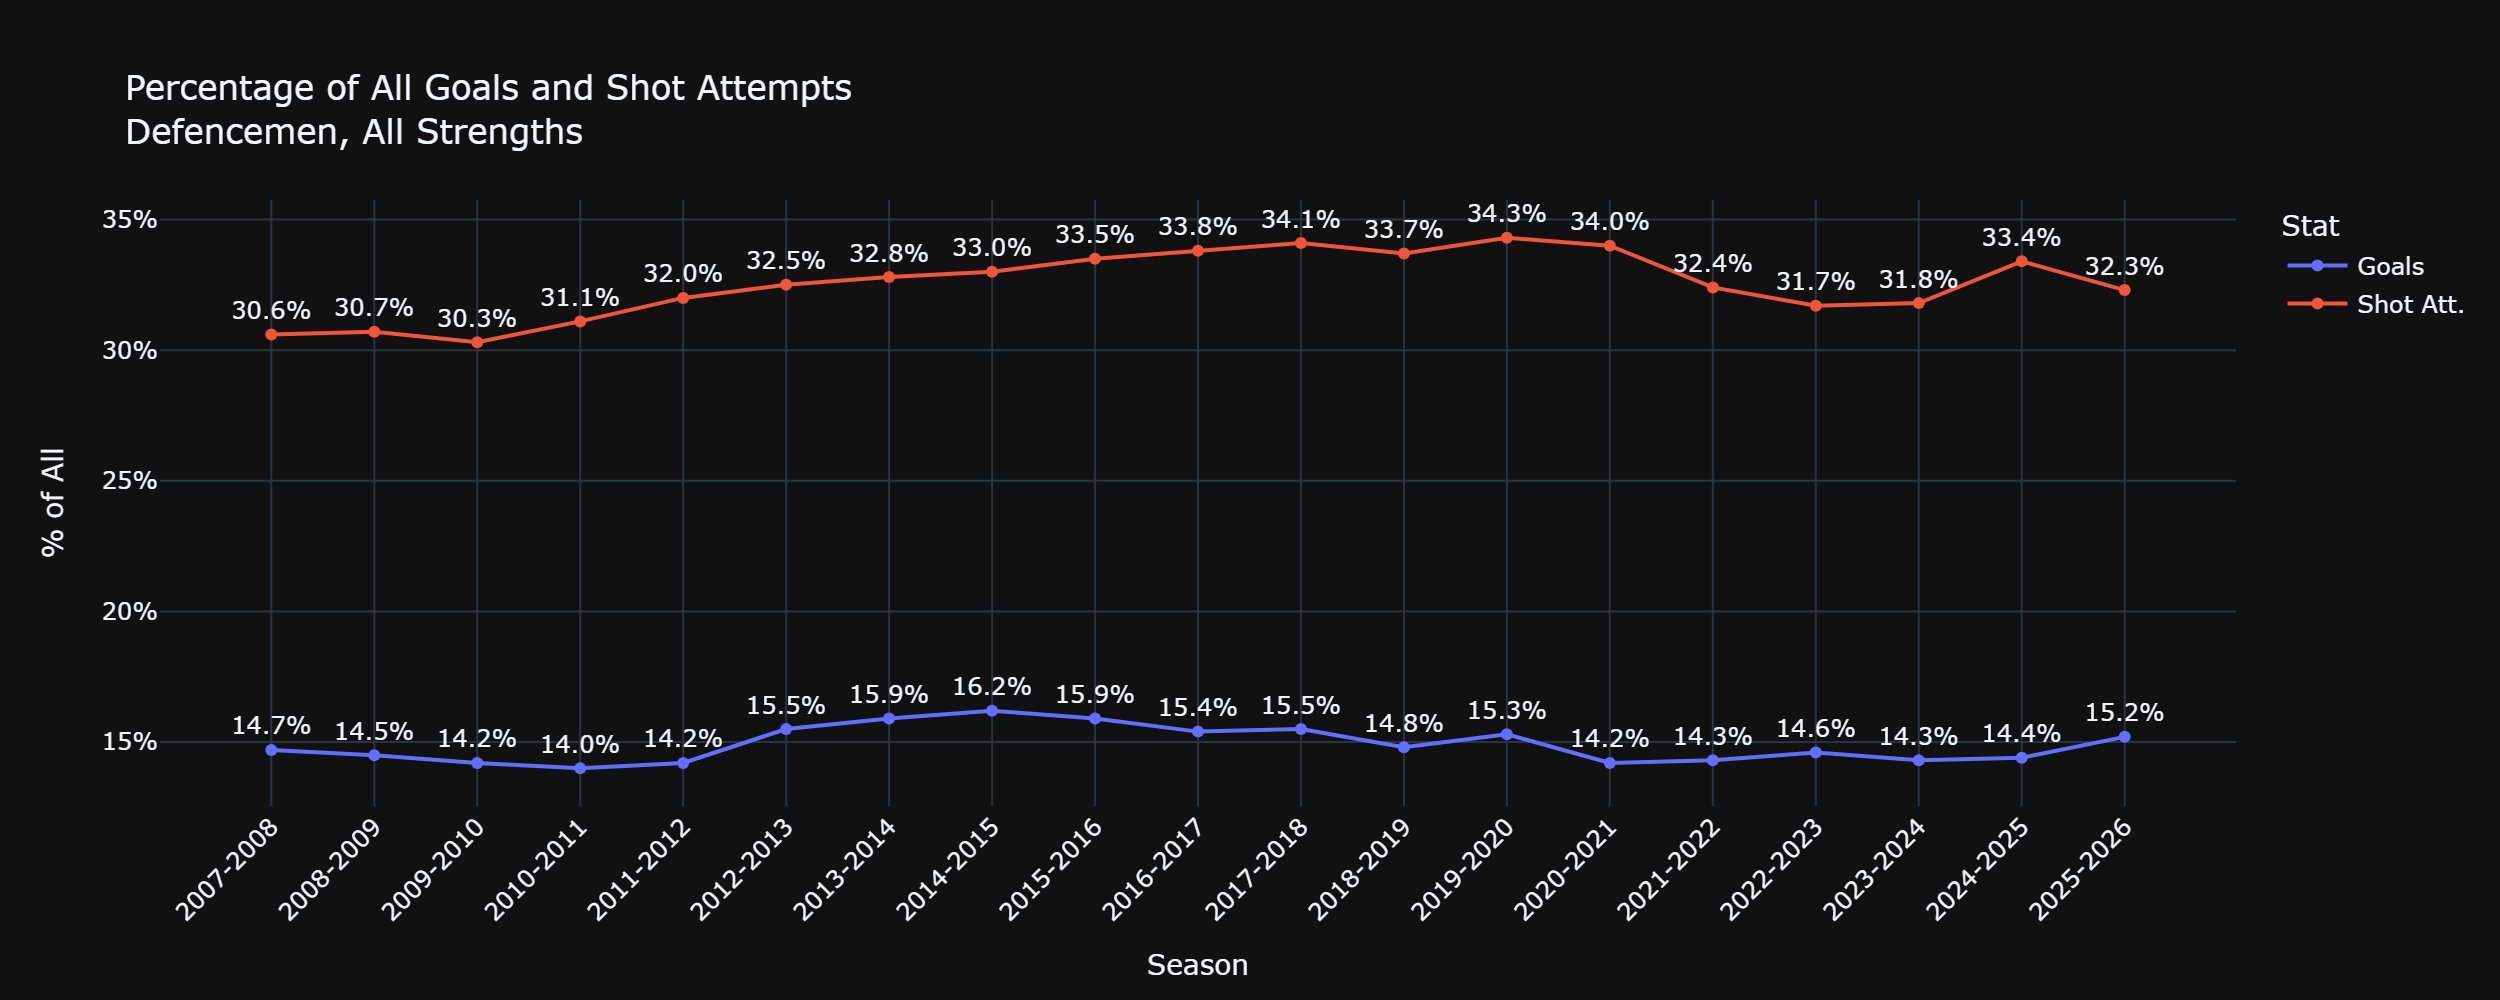
One big takeaway from the first article was that the changes we saw in the percentage of shot attempts and assists by defencemen depended on whether we were looking at all strengths, at 5-on-5, or on the power play. As teams moved away from the three-forward/two-defencemen power-play setup, the percentage of power-play shot attempts taken by defencemen unsurprisingly declined. That change was reflected in shots on goal, as the power-play peak was in the early 2010s with blue liners taking nearly one-third of all PP shots, a level that has been under 20% for five straight seasons, hovering around 18% for four seasons:
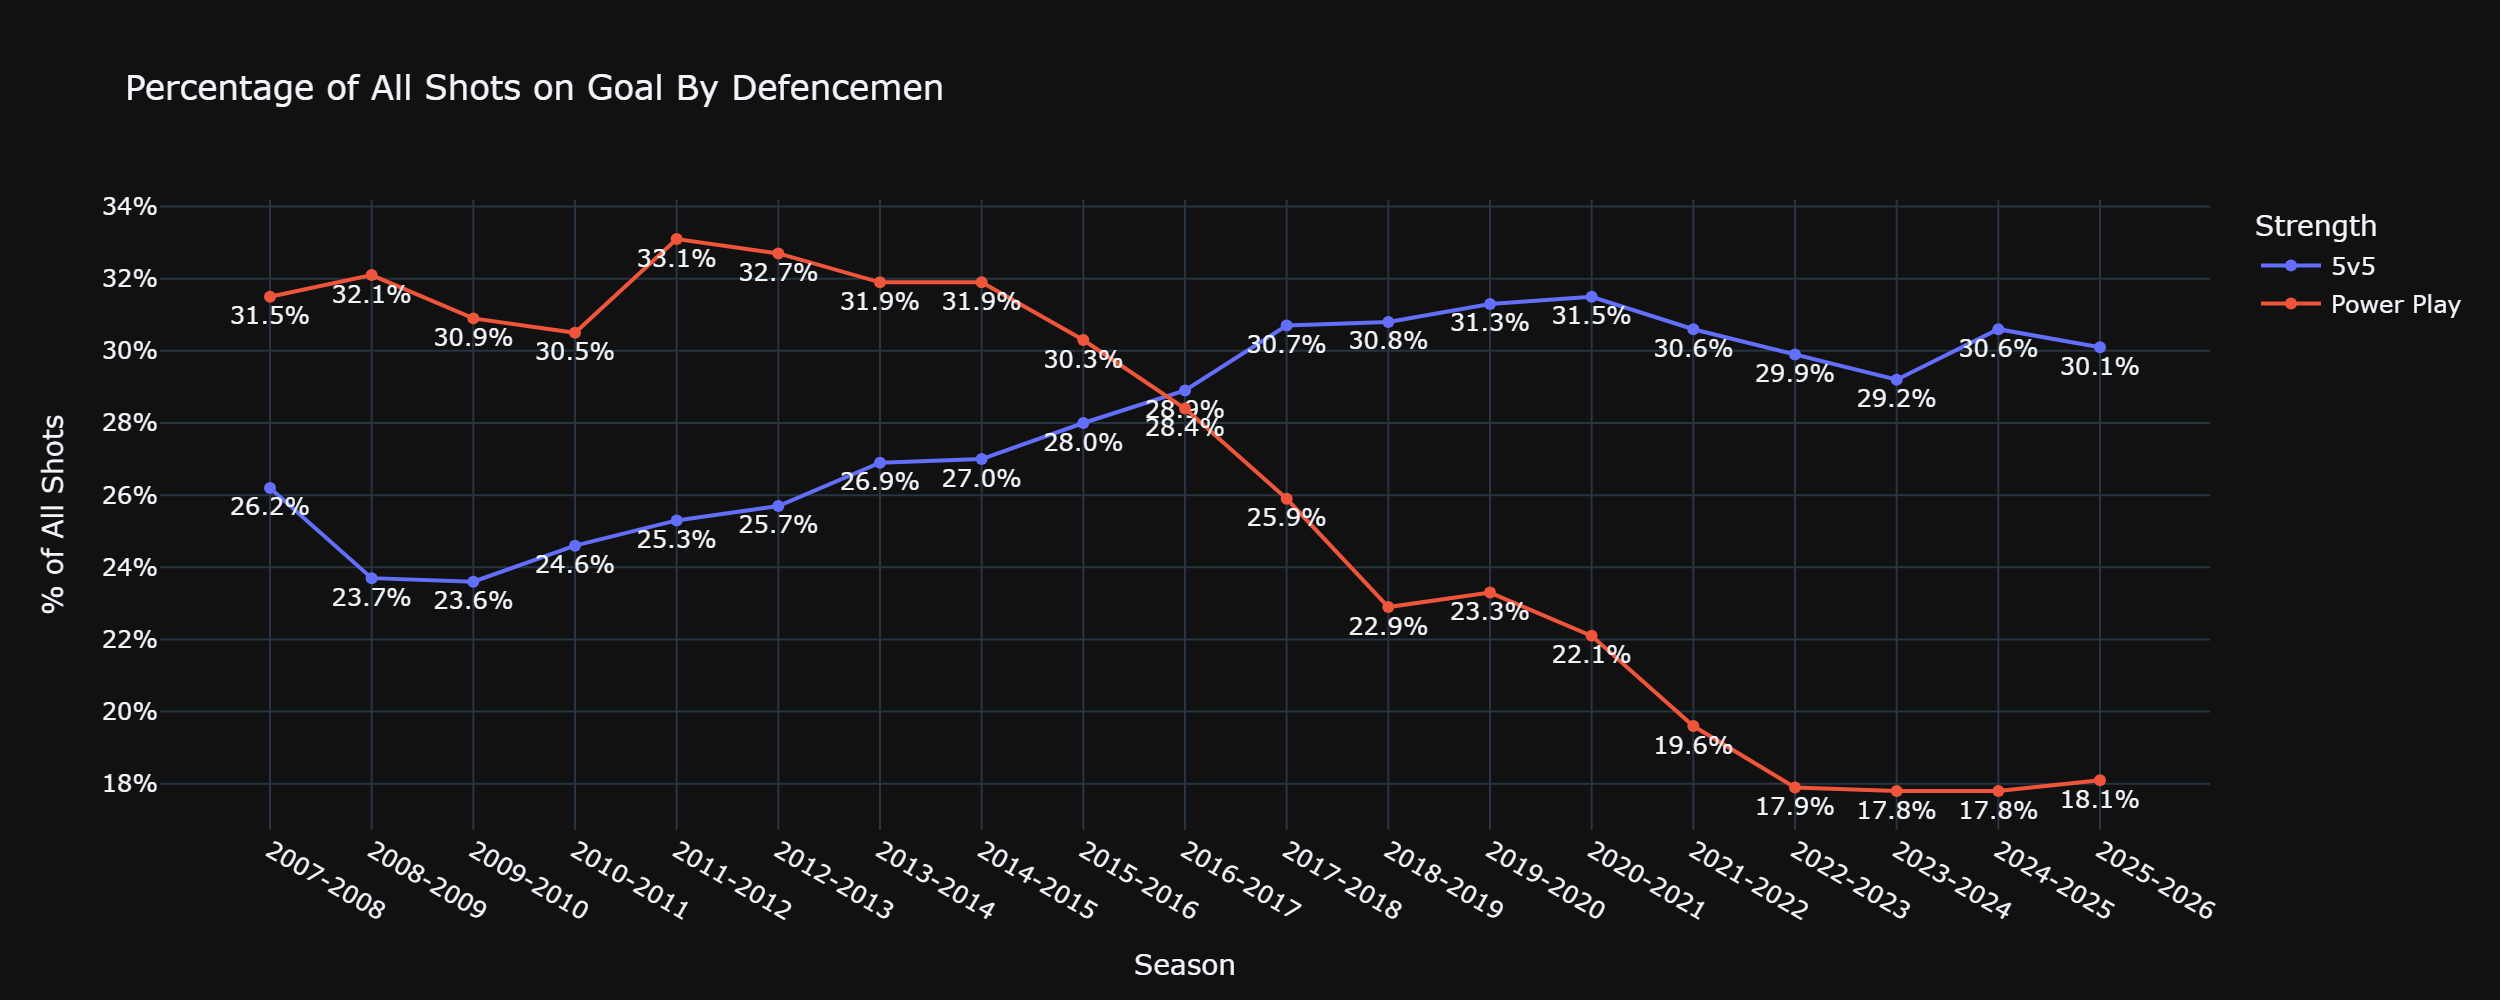
In this graph, the percentage of shots on goal at 5-on-5 rose from a low of 23.6% in 2009-10 to a peak of 31.5% in the Bubble 2021 season. It has remained between 29-31% in the five seasons since.
It can’t be overstated what a monumental change that is. For a bit of context, the Bubble 2021 season saw defencemen land 31.5% of the shots on goal. If they were still landing shots at the rate from 10 years earlier (23.6%), there would have been 25 fewer shots on goal every 82 individual games.
That defencemen saw a declining share of the power-play shots as fewer defencemen were earning power-play minutes makes sense, but that doesn’t tell the whole story. Even with the share of shots on the power play getting smaller once we entered the 2010s, the 60-minute rate of shots on goal by blue liners on the man advantage kept rising until 2018-19:
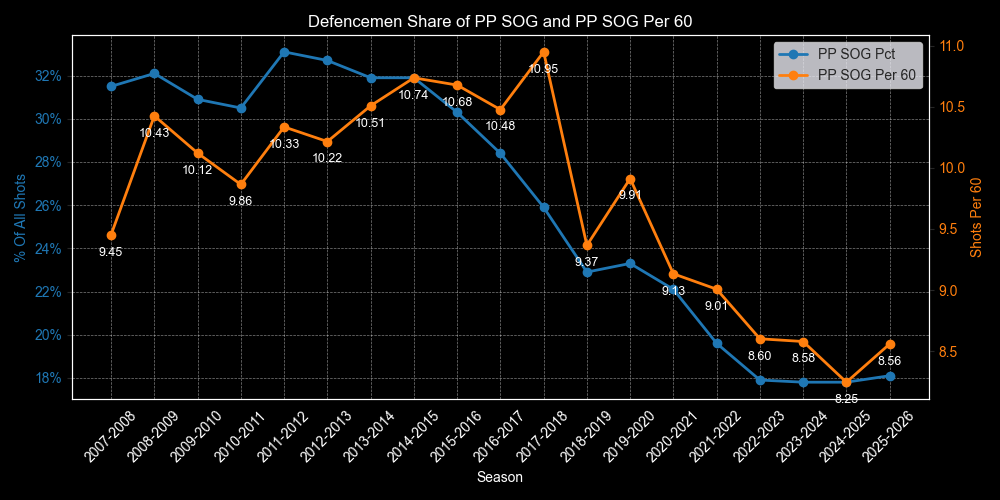
In the 2018-19 season, defencemen earned roughly 25.4% of the power-play time. This past season, that declined to 22%. Relatively speaking, that is a 13% drop of the total PP ice time. However, in that span, the 60-minute shot rate among defencemen has dropped by 9%, compared to a 21% drop in the percentage of all power-play shots. In short, the drop in 60-minute shot rate was less than the decline in ice time, but the waning of the share of PP shots was much greater than the PPTOI decline.
The changes in shots on goal were reflected in the changes in goal scoring as defencemen scored at least 15% of the goals in seven of the eight seasons from 2012-2020, a level they hadn’t reached before 2012. Keep in mind that this increase, and stabilization, in goal scoring is happening as fewer defencemen are getting power-play ice time. In a bit of symmetry, the 2012-13 season saw goal scoring from defencemen on the power play reach 20.5%, and that was the season where the true upswing in 5-on-5 goal scoring began:
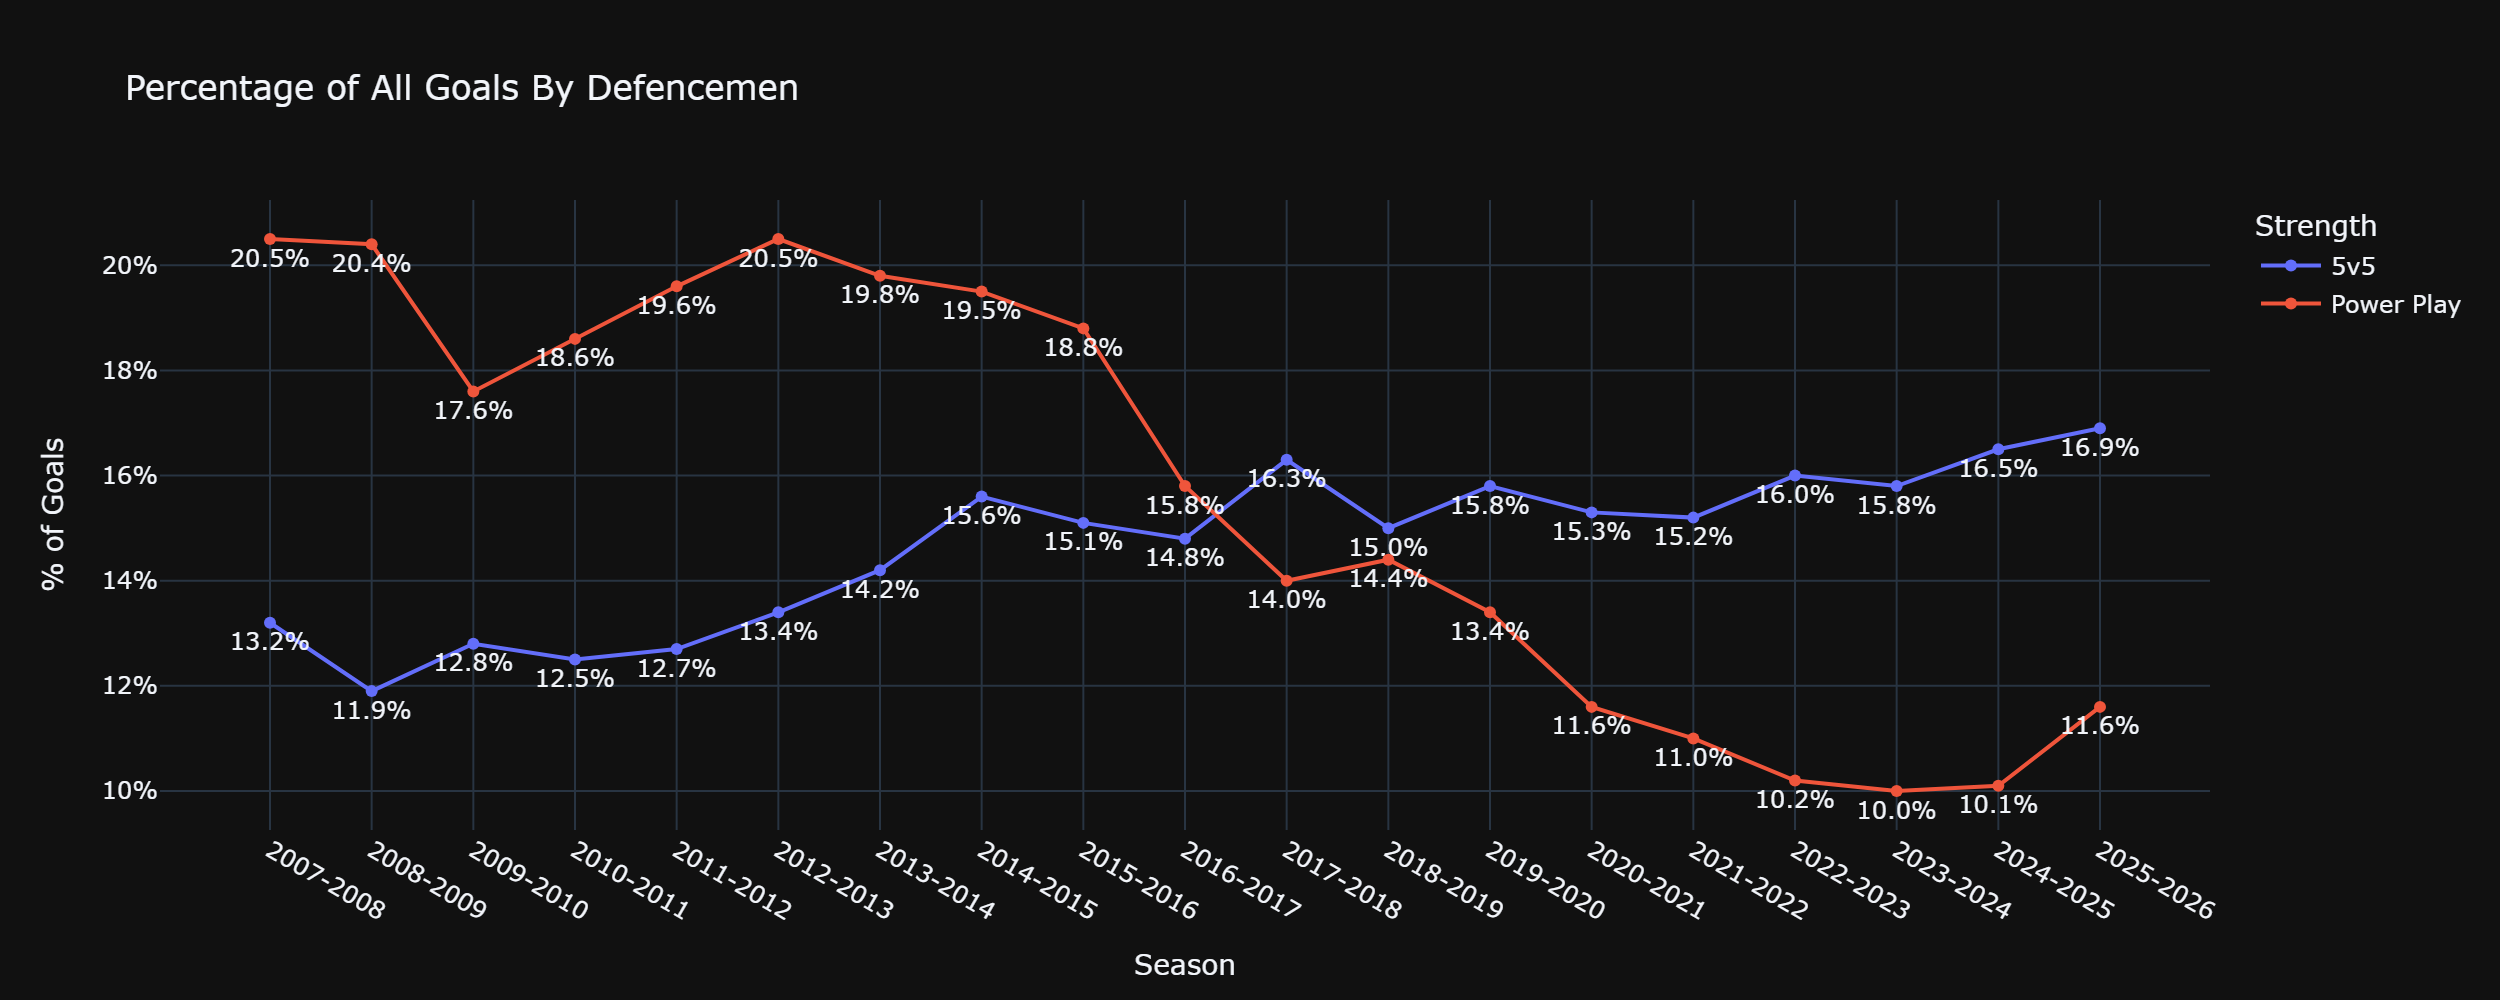
As expected, there’s a drop in power-play goal scoring as defencemen get less PPTOI. What is crazy is not only has there been a steady increase in 5-on-5 goal scoring from defencemen for 15 years, but the 2025-26 season saw their highest percentage of 5-on-5 goals in any season of the Analytics Era. The goal-scoring increase that started 15 years ago hasn’t stopped (yet).
The percentage of goals scored by defencemen is only part of the story. More goals from that position could simply be the result of a handful of high-end blue liners scoring more each season than they used to. That would be enough to drag the share of goals higher, and as we saw in 2025-26, there is no shortage of elite defencemen in the NHL.
What is really telling isn’t just that defencemen are scoring a higher percentage of the goals, but that the upper-middle class of defencemen is getting bigger. To illustrate this, we’ll use a density plot to show goals per game by blue liners. The higher the number of defencemen in a particular goal-scoring range, the wider the plot. Going back to 2007-08 and including only those who played at least 25 games in a season, here are the 5-on-5 scoring rates per 82 games among defencemen:
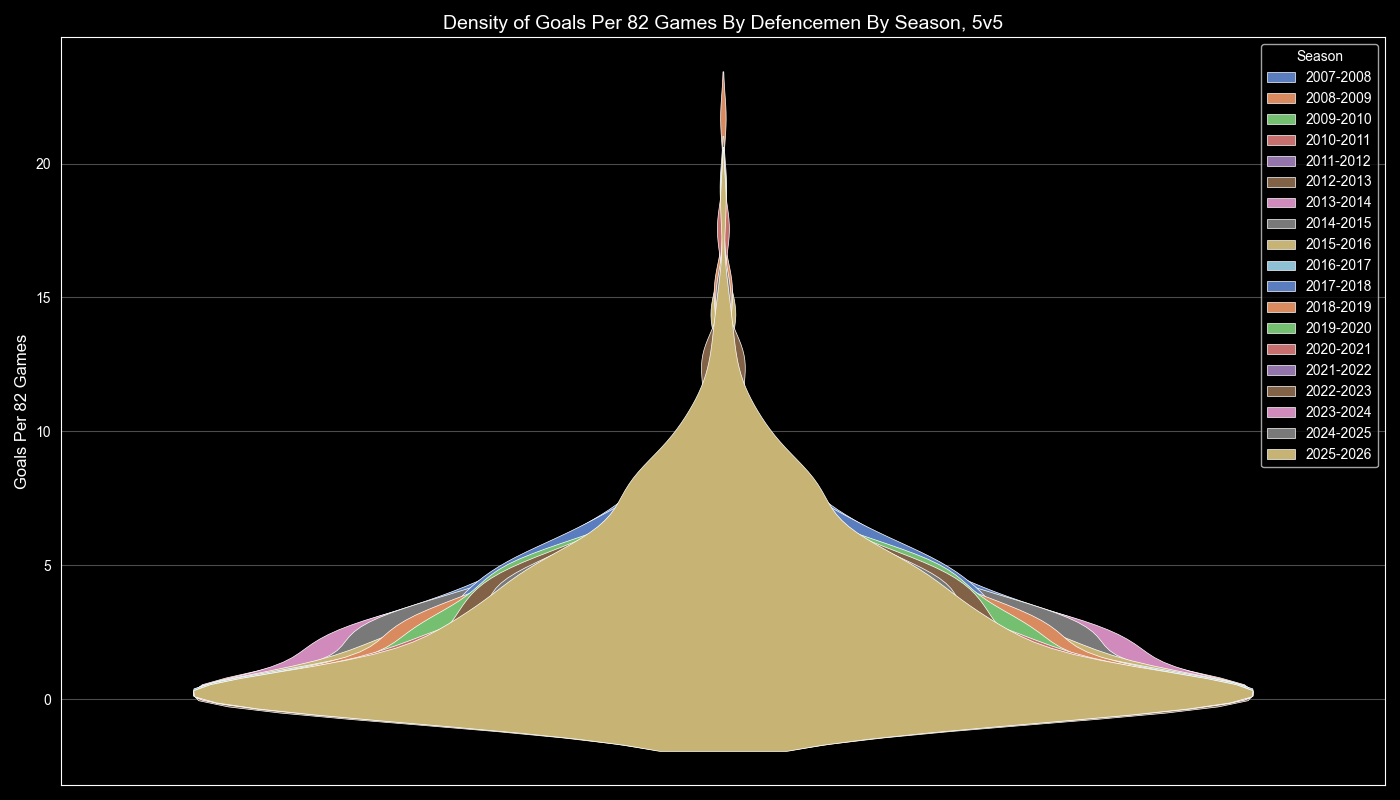
The brown plot overlapping almost everything was this past 2025-26 season. Notice how when we get to about 7.5 goals per 82 games, nearly all the way through 15 goals per 82 games, the brown plot overlaps the other years? That means this past season saw more defencemen score in that rough 7.5-15 goals per 82 game range than any prior campaign. We see some small blips around the 13-goal mark, which is the 2022-23 season, and another just above it from 2015-16, but by-and-large, that upper-mid goal-scoring range is dominated by the 2025-26 season.
The same can be said for goal-scoring on a 60-minute basis. If we limit the sample to blue liners with at least 600 minutes played in a season, just about the entire range from 0.4 goals to 0.7 goals per 60 minutes belongs to the 2025-26 season:
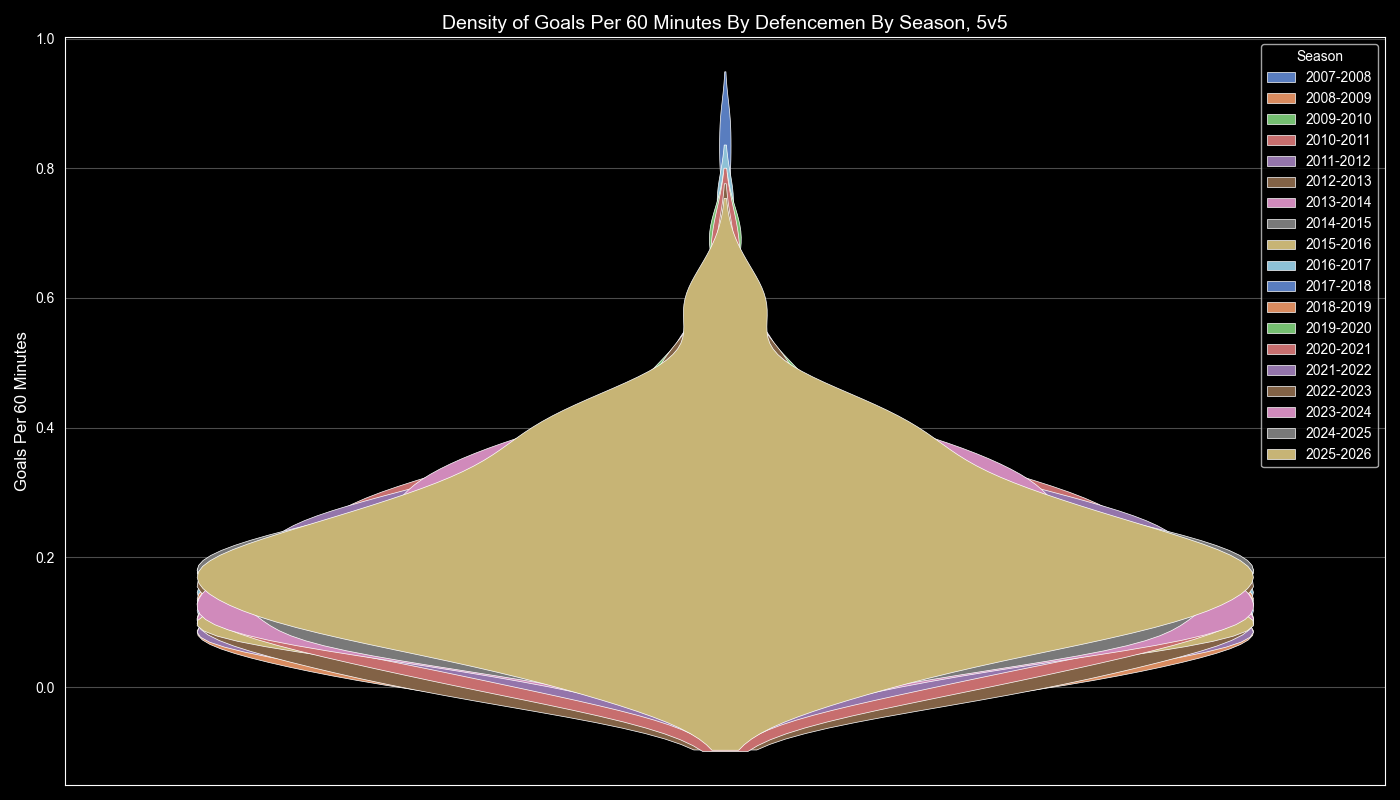
If we take a random cut-off point, there were 21 defencemen in the 2025-26 season who played at least 600 minutes at 5-on-5 and scored at least 0.4 goals per 60 minutes. In the first post-Covid season of 2021-22, there were 14 of those blue liners. Going back 10 years to the 2015-16 season, just eight defencemen reached that mark. The upper-middle class of rearguards is thriving.
Notice the bottom end of the chart. The size of the brown plot gets smaller, which means the 2025-26 campaign saw fewer defencemen score under 0.2 goals per game than most seasons in the Analytics Era. The bottom-end of defencemen is shrinking, which likely means two things:
1. It is getting harder for defencemen with limited offensive skills to score goals
2. Defencemen with limited offensive skills are getting pushed out of the league
One is related to the other, and not every defenceman has to score 10 goals every 82 games, but it’s undeniable that the lower-class of goal-scoring blue liners is disappearing while the upper-middle-glass is growing.
Until next time.