10 Interesting (To Me) Stats For This Week - May 12, 2026
Welcome back to another week of ’10 Interesting (To Me) Stats’! This week, we’re going to explore the idea of physicality in the postseason. We always say that the NHL playoffs are a different beast than the regular season, so let’s investigate what that means from the perspective of hits taken/given.
We are using data from Evolving Hockey and everything is current as of Monday, May 11th.
1 – What Regularly Happens
To compare the changes in the playoffs, we need to know what happens in the regular season. Let’s go back over the last 10 full regular seasons, so excluding the shortened 2019-20 and 2020 campaigns. How has the rate of hits in the regular season changed over the years? Well:
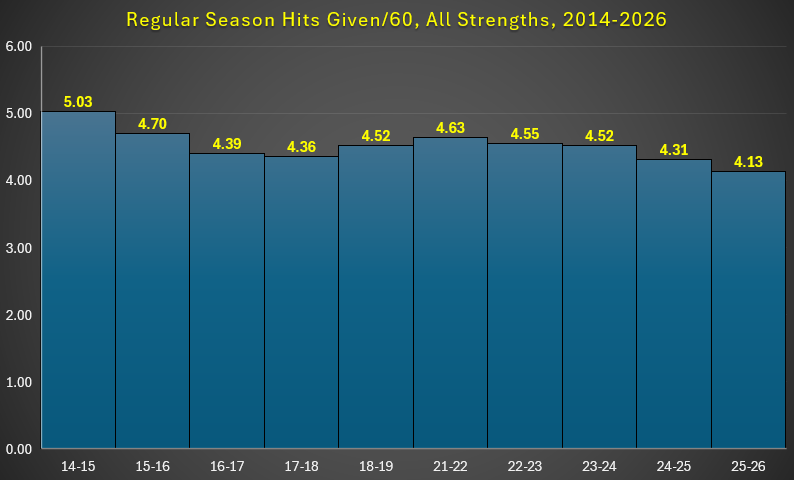
The 2025-26 regular season saw players average 4.13 hits per 60 minutes, the lowest of the last 10 full seasons, and nearly 11% lower than just four years ago. We could break this down by position – something to keep in mind for another day – but the rate of hits through the 82-game schedule has been on a clear downswing over the last five seasons.
2 – Does It Help?
The thing about hits is that you rarely have the puck when you give a hit. If you don’t have the puck, you’re unlikely to score. We all know this, but it’s important to see it, too. So, if we look at each team’s hit differential per 60 minutes (Hits Given – Hits Taken) from each of the last 10 seasons, and that team’s goal share, what do we see? Well:
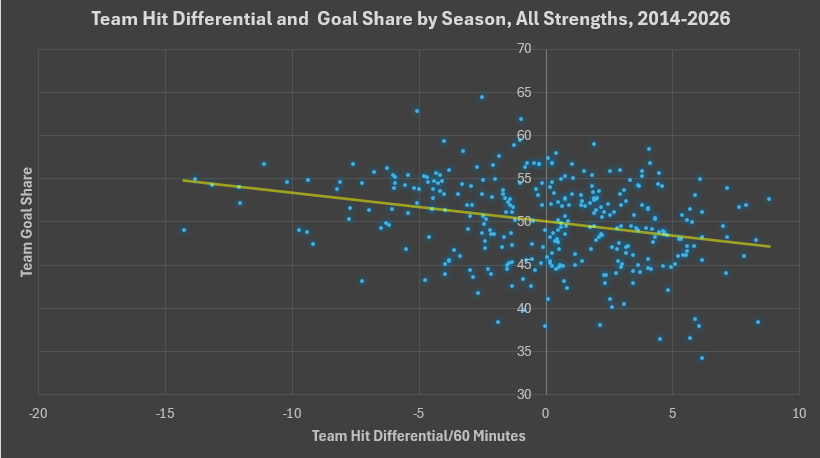
Remember that a negative hit differential means that team was getting hit more than they were dishing them out. It also (likely) means that team had the puck more, and that is reflected in their goal shares – teams took more hits than they gave tended to have a higher share of the goals. Being overly physical in the regular season often led to worse results, though there are always exceptions.
3 – What About the Playoffs?
Now that we’ve shown the decline in hits in the regular season, and what hitting more than the opponent is likely to mean, let’s get to the playoffs. Much like we saw in the regular season, there has been a change of physicality over the years, though unlike we saw in the regular season, the rate of hits has been rising substantially rather than declining:
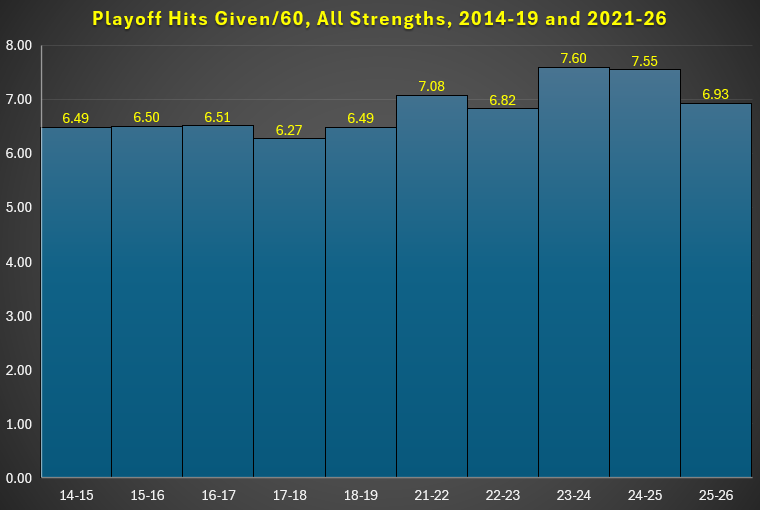
Keep in mind that we still have dozens of games left to play in the 2026 playoffs, but there is a clear change: from 2014-2019, teams typically averaged around 6.5 hits given per 60 minutes, but the last five seasons have seen postseason teams average between 6.8 – 7.6 hits/60 (the hit rate in 2023-24 was 21% higher than in 2017-18). It isn’t just your eyes or brain playing tricks on you – the playoffs are more physical now than they were just seven years ago.
4 – Does It Help? Part Deux
Physicality goes up in the playoffs, rising considerably from the regular season. Okay, sure. But does it help? It might be a bit surprising – or not – to learn that just like the regular season, teams that have positive hit differentials, meaning they hit the opponent more than they get hit, tend to have worse goal shares:
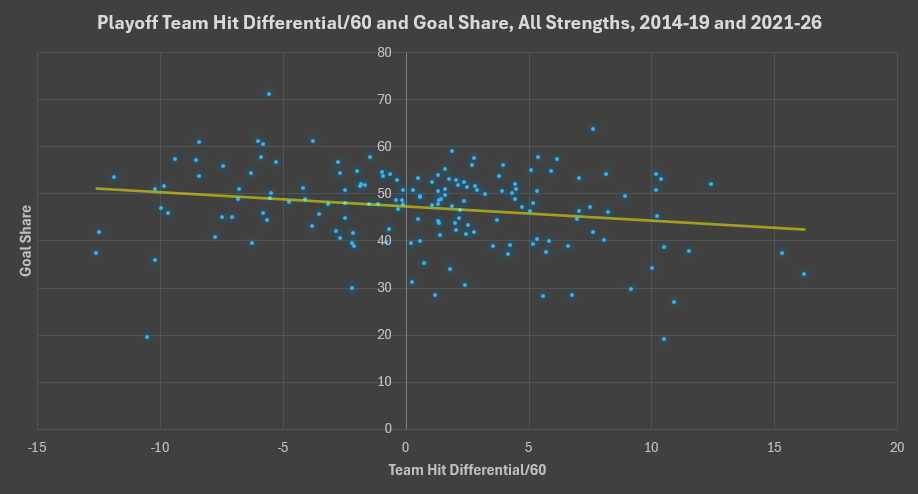
There are always exceptions, and the most recent is the two-time-champion Florida Panthers. But the two years before that saw Stanley Cup wins from Colorado and Vegas, both teams with sizeable negative hit differentials, meaning they were getting hit a lot more than they were laying the body. Perhaps the lesson from Florida is less outright physicality, and more that when your roster is so deep that Matthew Tkachuk is your *second* right winger and Brandon Montour is on your second defence pair, you can get away with being more physical than less-deep rosters.
Now that we know what happens at the team level, which players have seen significant hit differential changes in the 2026 postseason?
5 – (Not) Carrier-ing the Play
Carolina has swept the first two rounds, putting up a +70 shot differential in 538 minutes of ice time. Knowing that, we might think their players have been getting hit a lot more than they have been giving it, and it’s true for some, but not for all, as William Carrier’s increased hit differential is the runaway leader in the playoffs, nearly double the next-closest player:
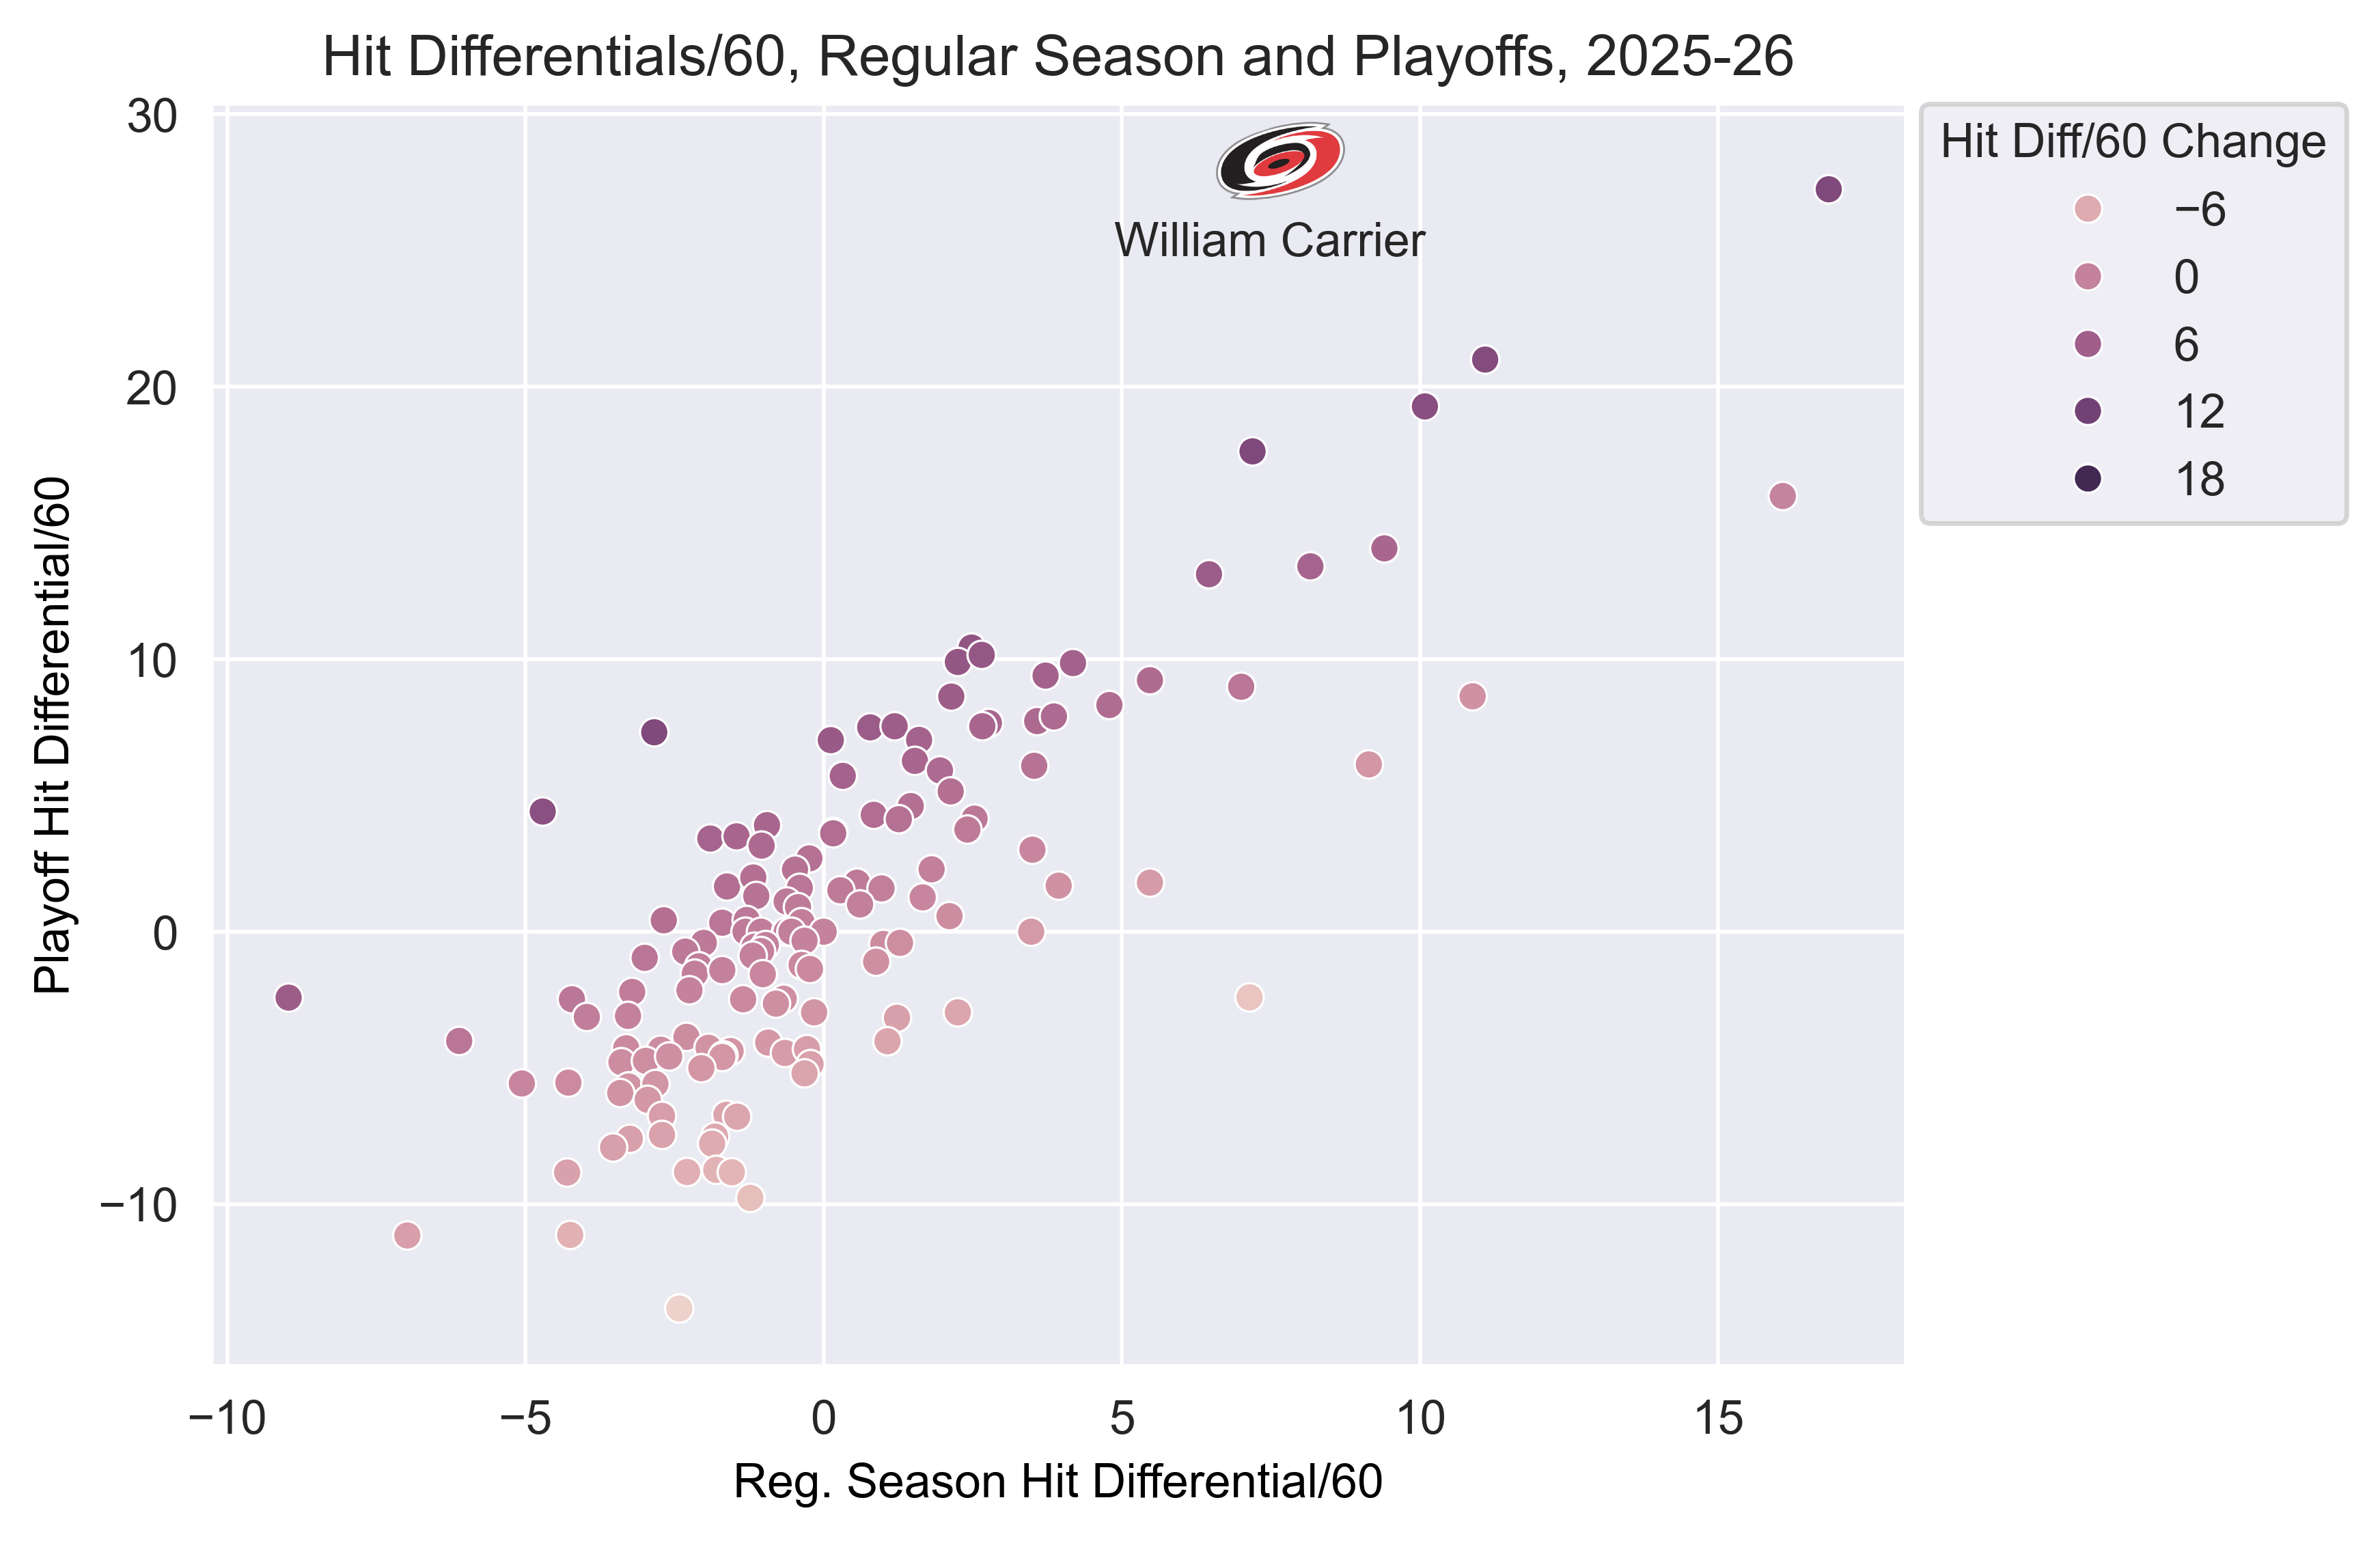
In just under 83 minutes of total ice time, Carrier has been credited with 48 hits. On a per-minute basis, he is far-and-away the hit-rate leader so far in these playoffs. Carolina’s fourth line has been the one line to generally struggle at controlling the play, so an increase makes sense. But at this level? My guy is mainlining Red Bull-infused coffee beans before every period.
6 – The Arberist
Montreal is a team that has found success, and is finding success, because they have skill up and down the lineup. That doesn’t mean they aren’t without physical play, though, and no one embodies that more than defenceman Arber Xhekaj, who has the second-largest increase in hit differential so far this postseason:
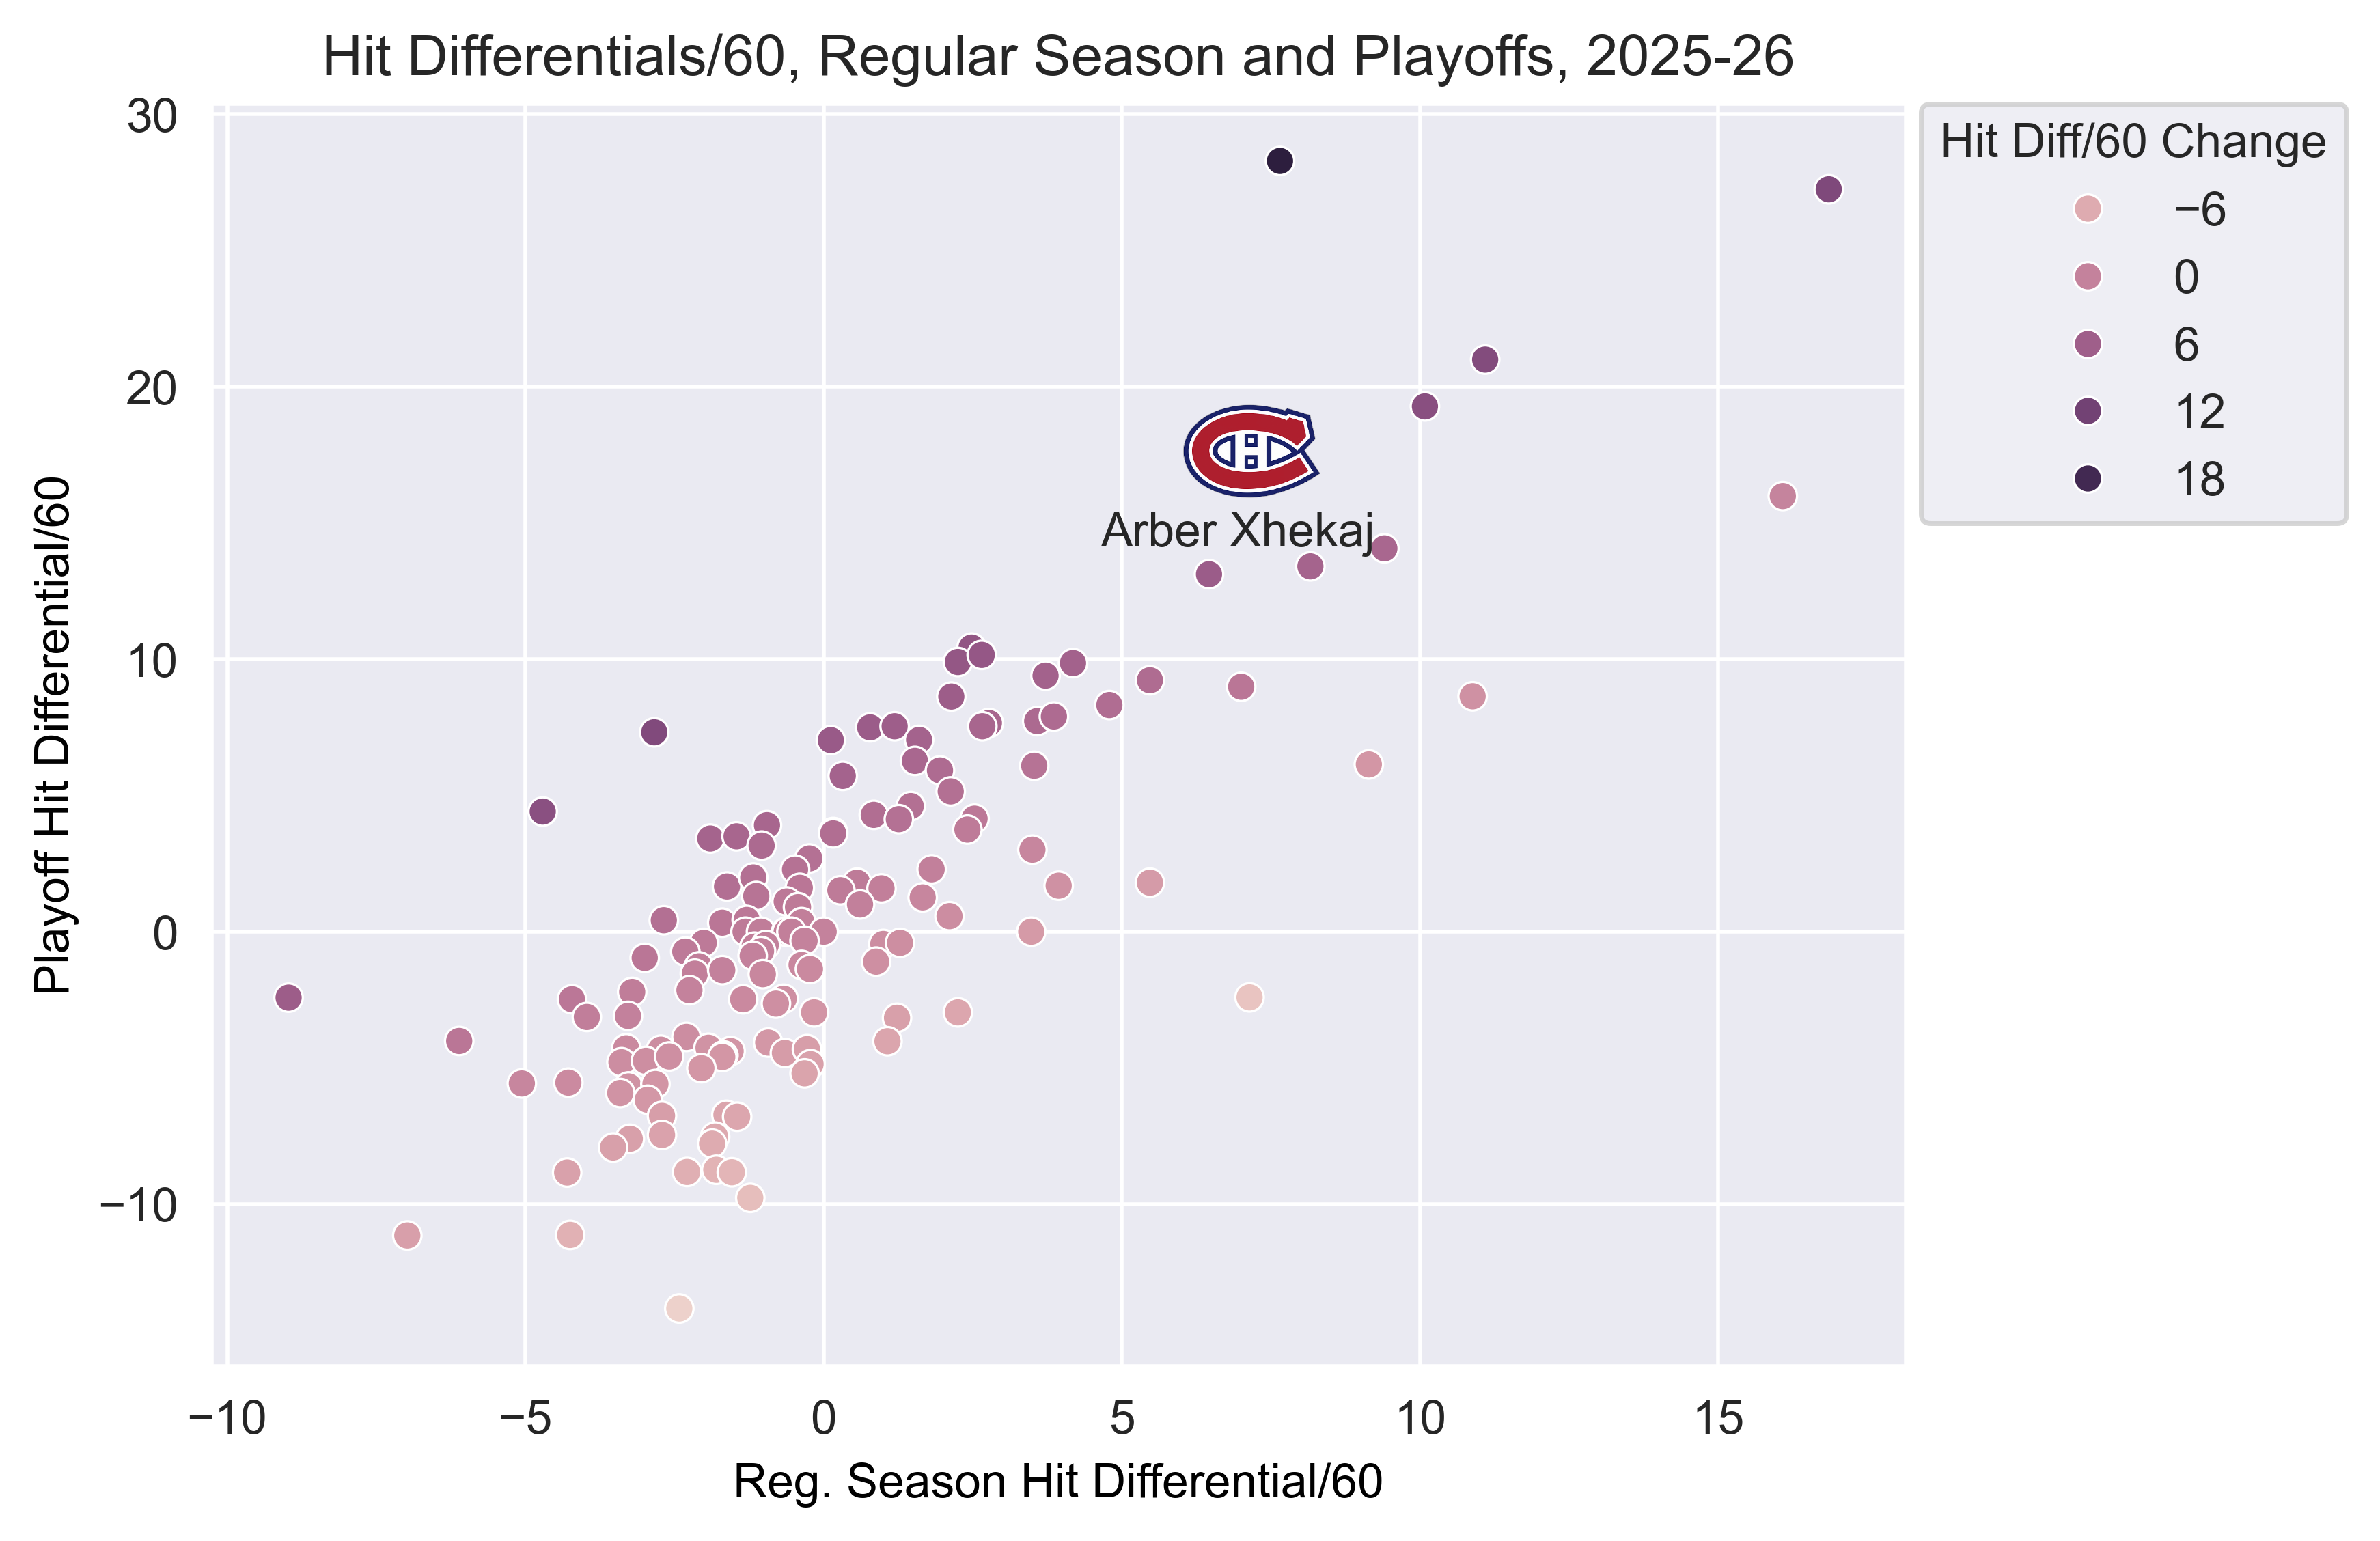
To be clear, Carrier is leaps-and-bounds ahead of Xhekaj by increased hit differential, but Montreal’s third-pair blue liner has a defined role, and he’s been mostly excellent in that role to this point. He is one of the exceptions where Montreal is controlling the play with him on the ice and he’s laying the body at an exceedingly high rate.
7 – The Barber
Vegas finds themselves in a 2-2 series against Anaheim, and as we saw with Xhekaj, Vegas forward Ivan Barbashev is one of our exceptions where his team is controlling the play with him on the ice (53% shot attempt share) through both rounds, which is why his hit differential increasing from 2.5 per 60 minutes to 10.4 per 60 minutes is very notable:
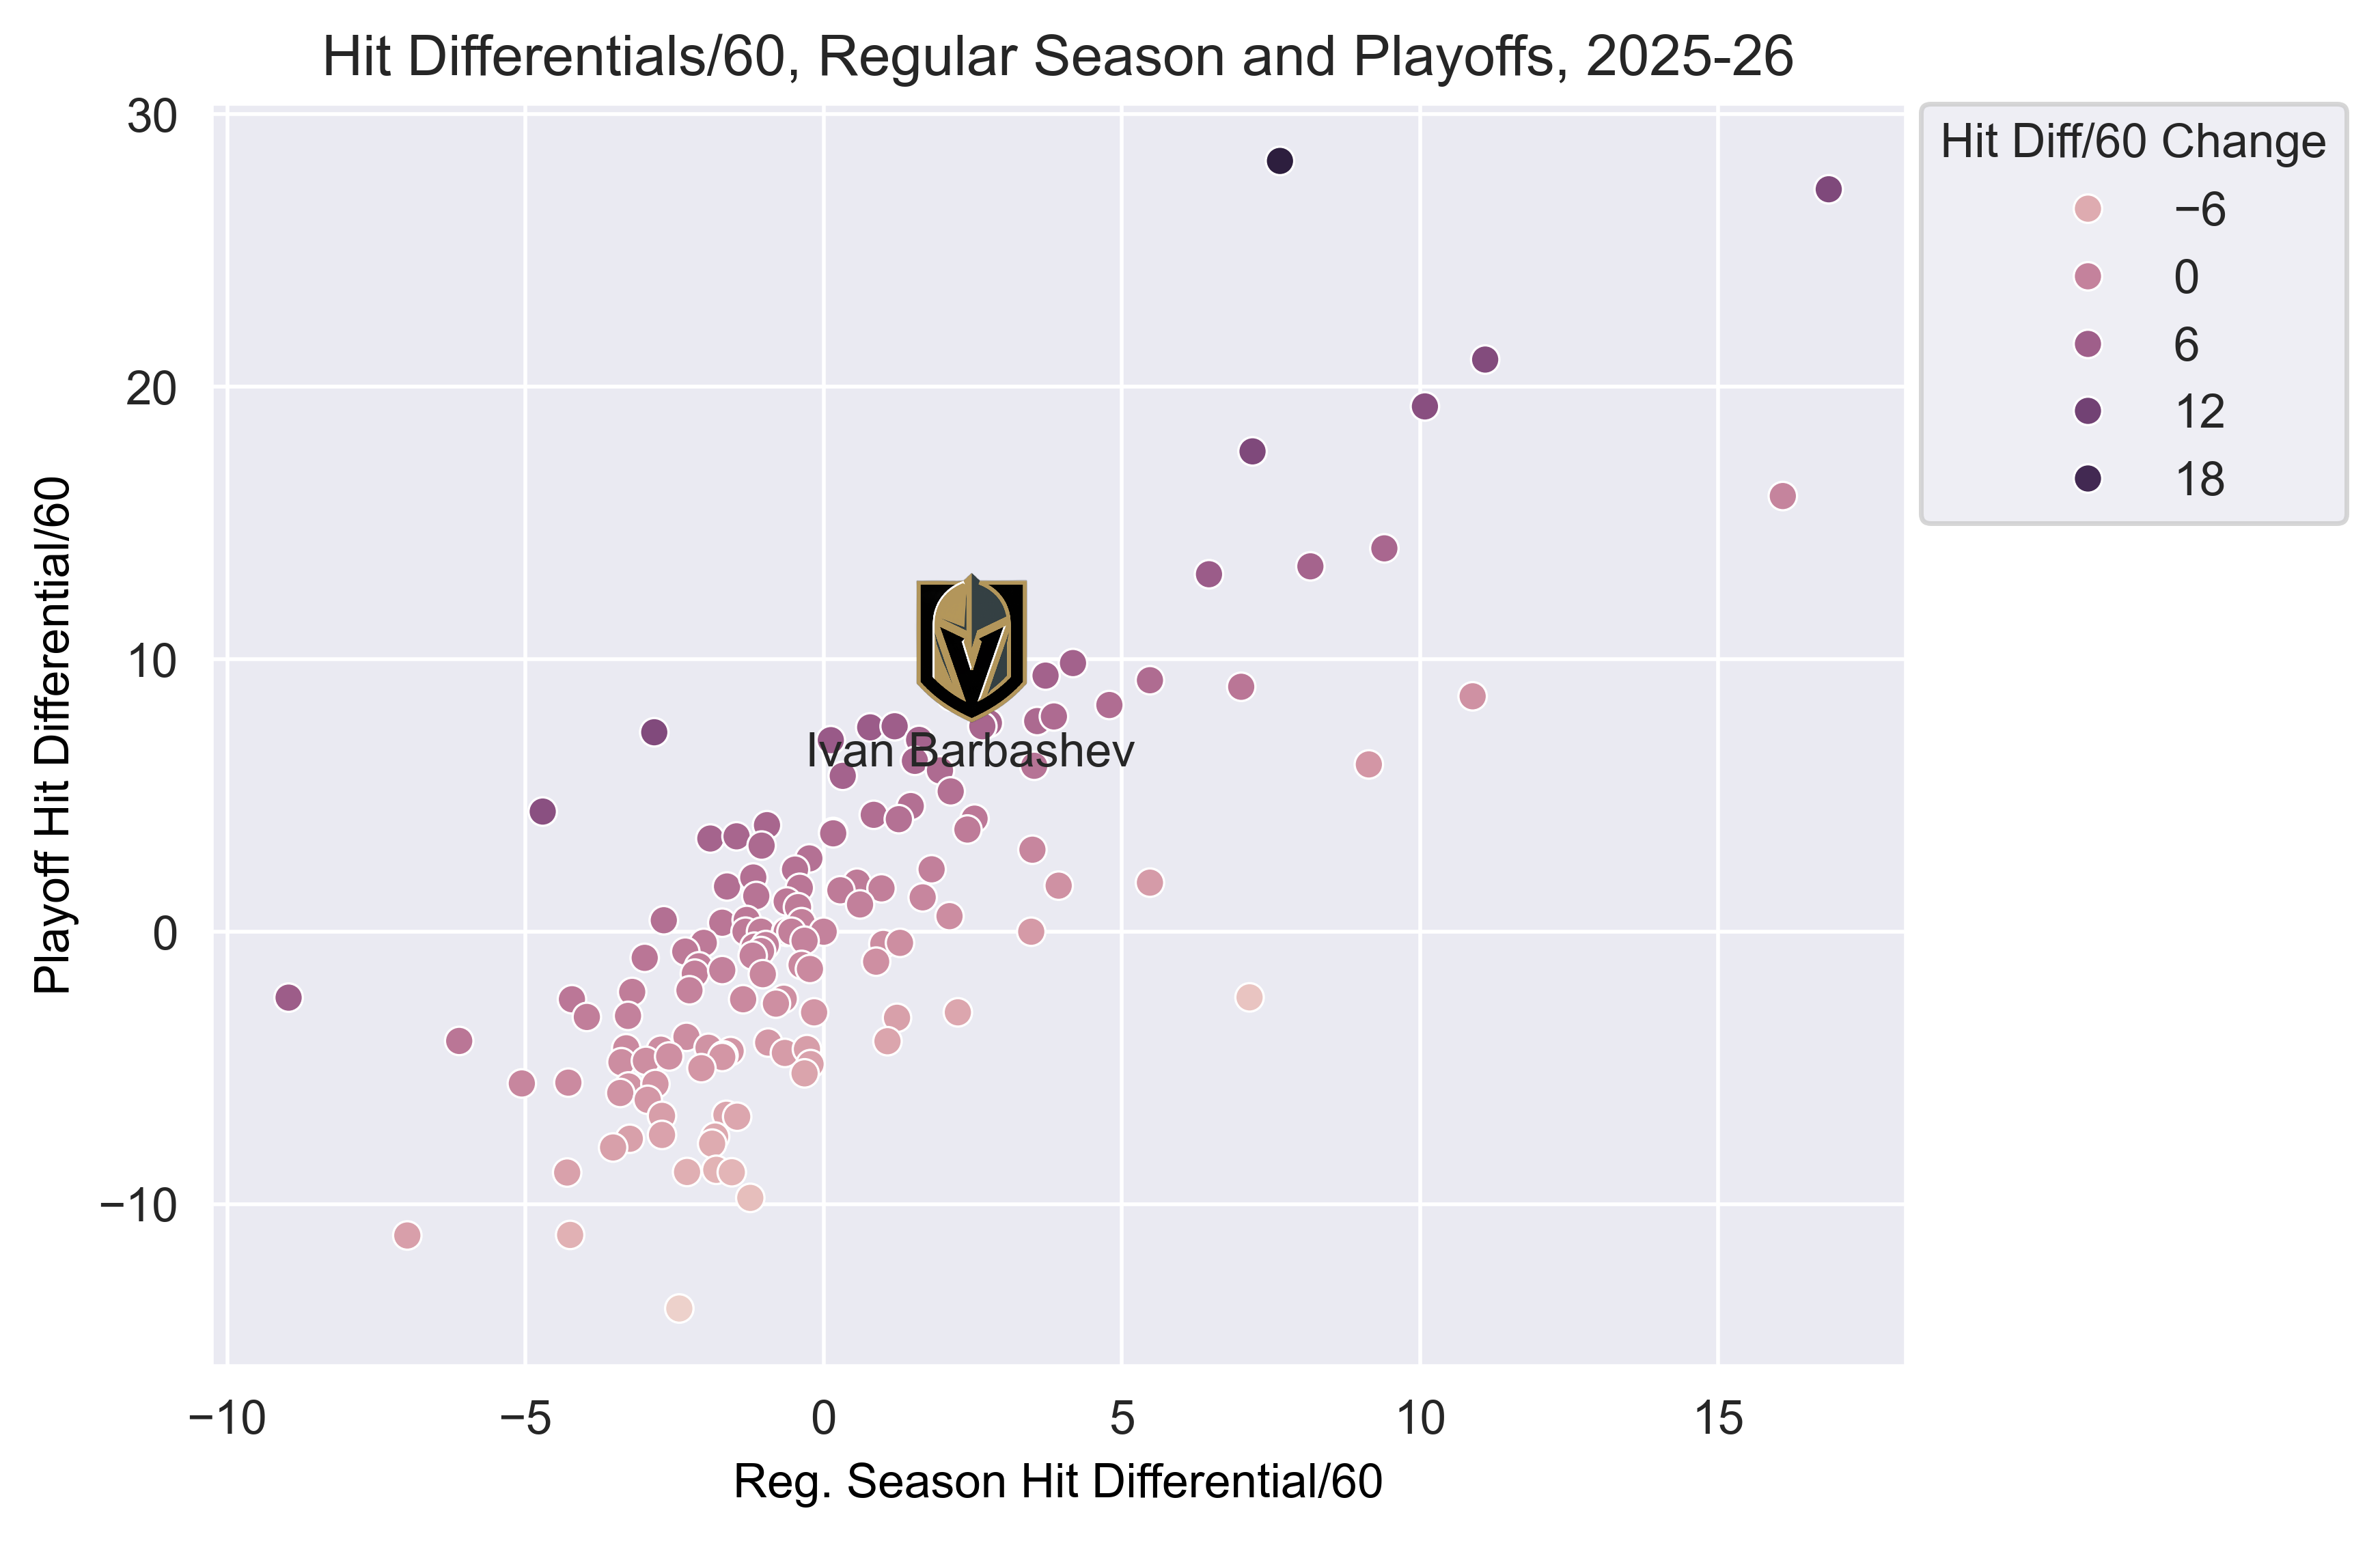
In 65 minutes of ice time in the series against Anaheim, Barbashev is already up to 17 hits, which leads the Golden Knights. The team also has a +4 shot differential and +2 goal differential when he’s on the ice. Not only is he being overly physical, but Vegas is winning his minutes, too. That is the type of combination that will endear him to his new coach.
8 – Namesake
At the Trade Deadline, the Buffalo Sabres acquired defenceman Logan Stanley for some depth on the blue line. What is interesting is that through his eight playoff games, the team is losing the shot attempt battle with him on the ice (45% share) and he’s seen a substantial decline in his hit differential per 60 minutes:
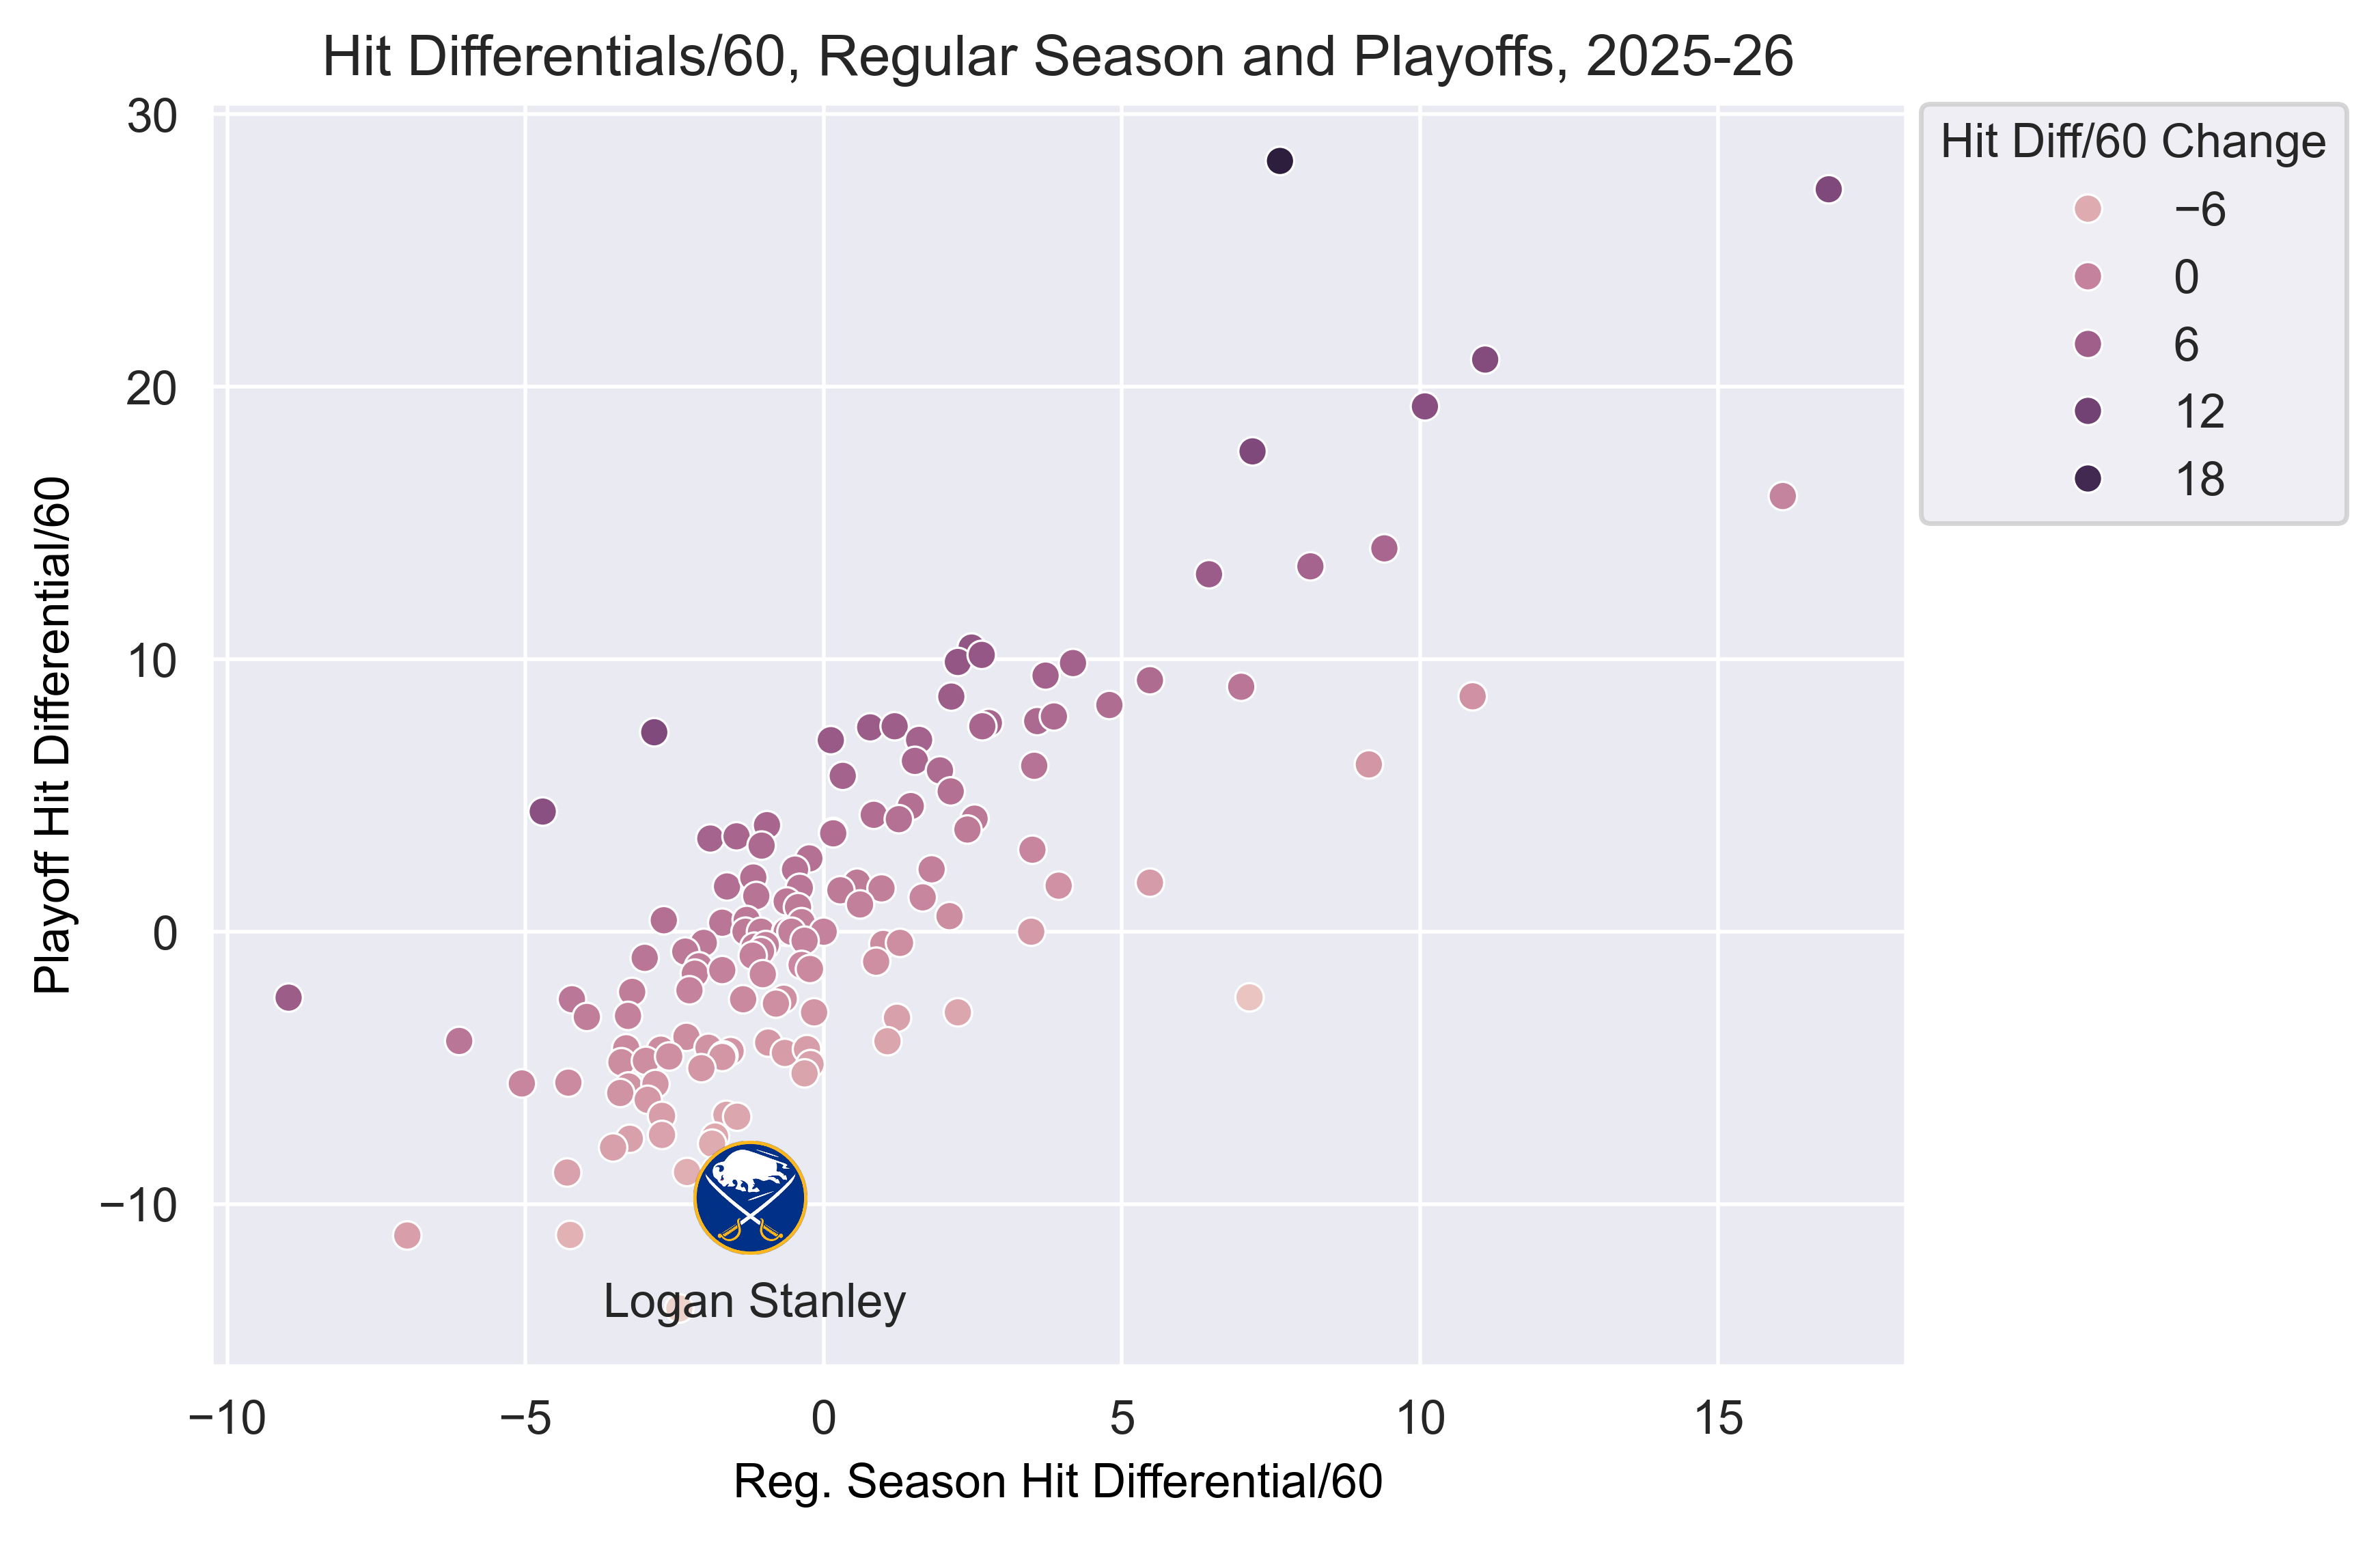
In the regular season – including his time in Winnipeg – Stanley had a slightly negative hit differential (-1.2/60). In the playoffs, that has grown substantially to -9.8. He is getting hit much more than usual, and for a player brought in for his physicality who is also losing the shot battle, that is a peculiar turn of events.
9 – Nasty Naz
In a similar range to Stanley is Colorado forward Nazem Kadri. He had a slightly negative hit differential in the regular season, but has seen a sizeable decline in the hit differential so far in the postseason, leading to the fifth-largest decline of the 145 skaters in our sample:
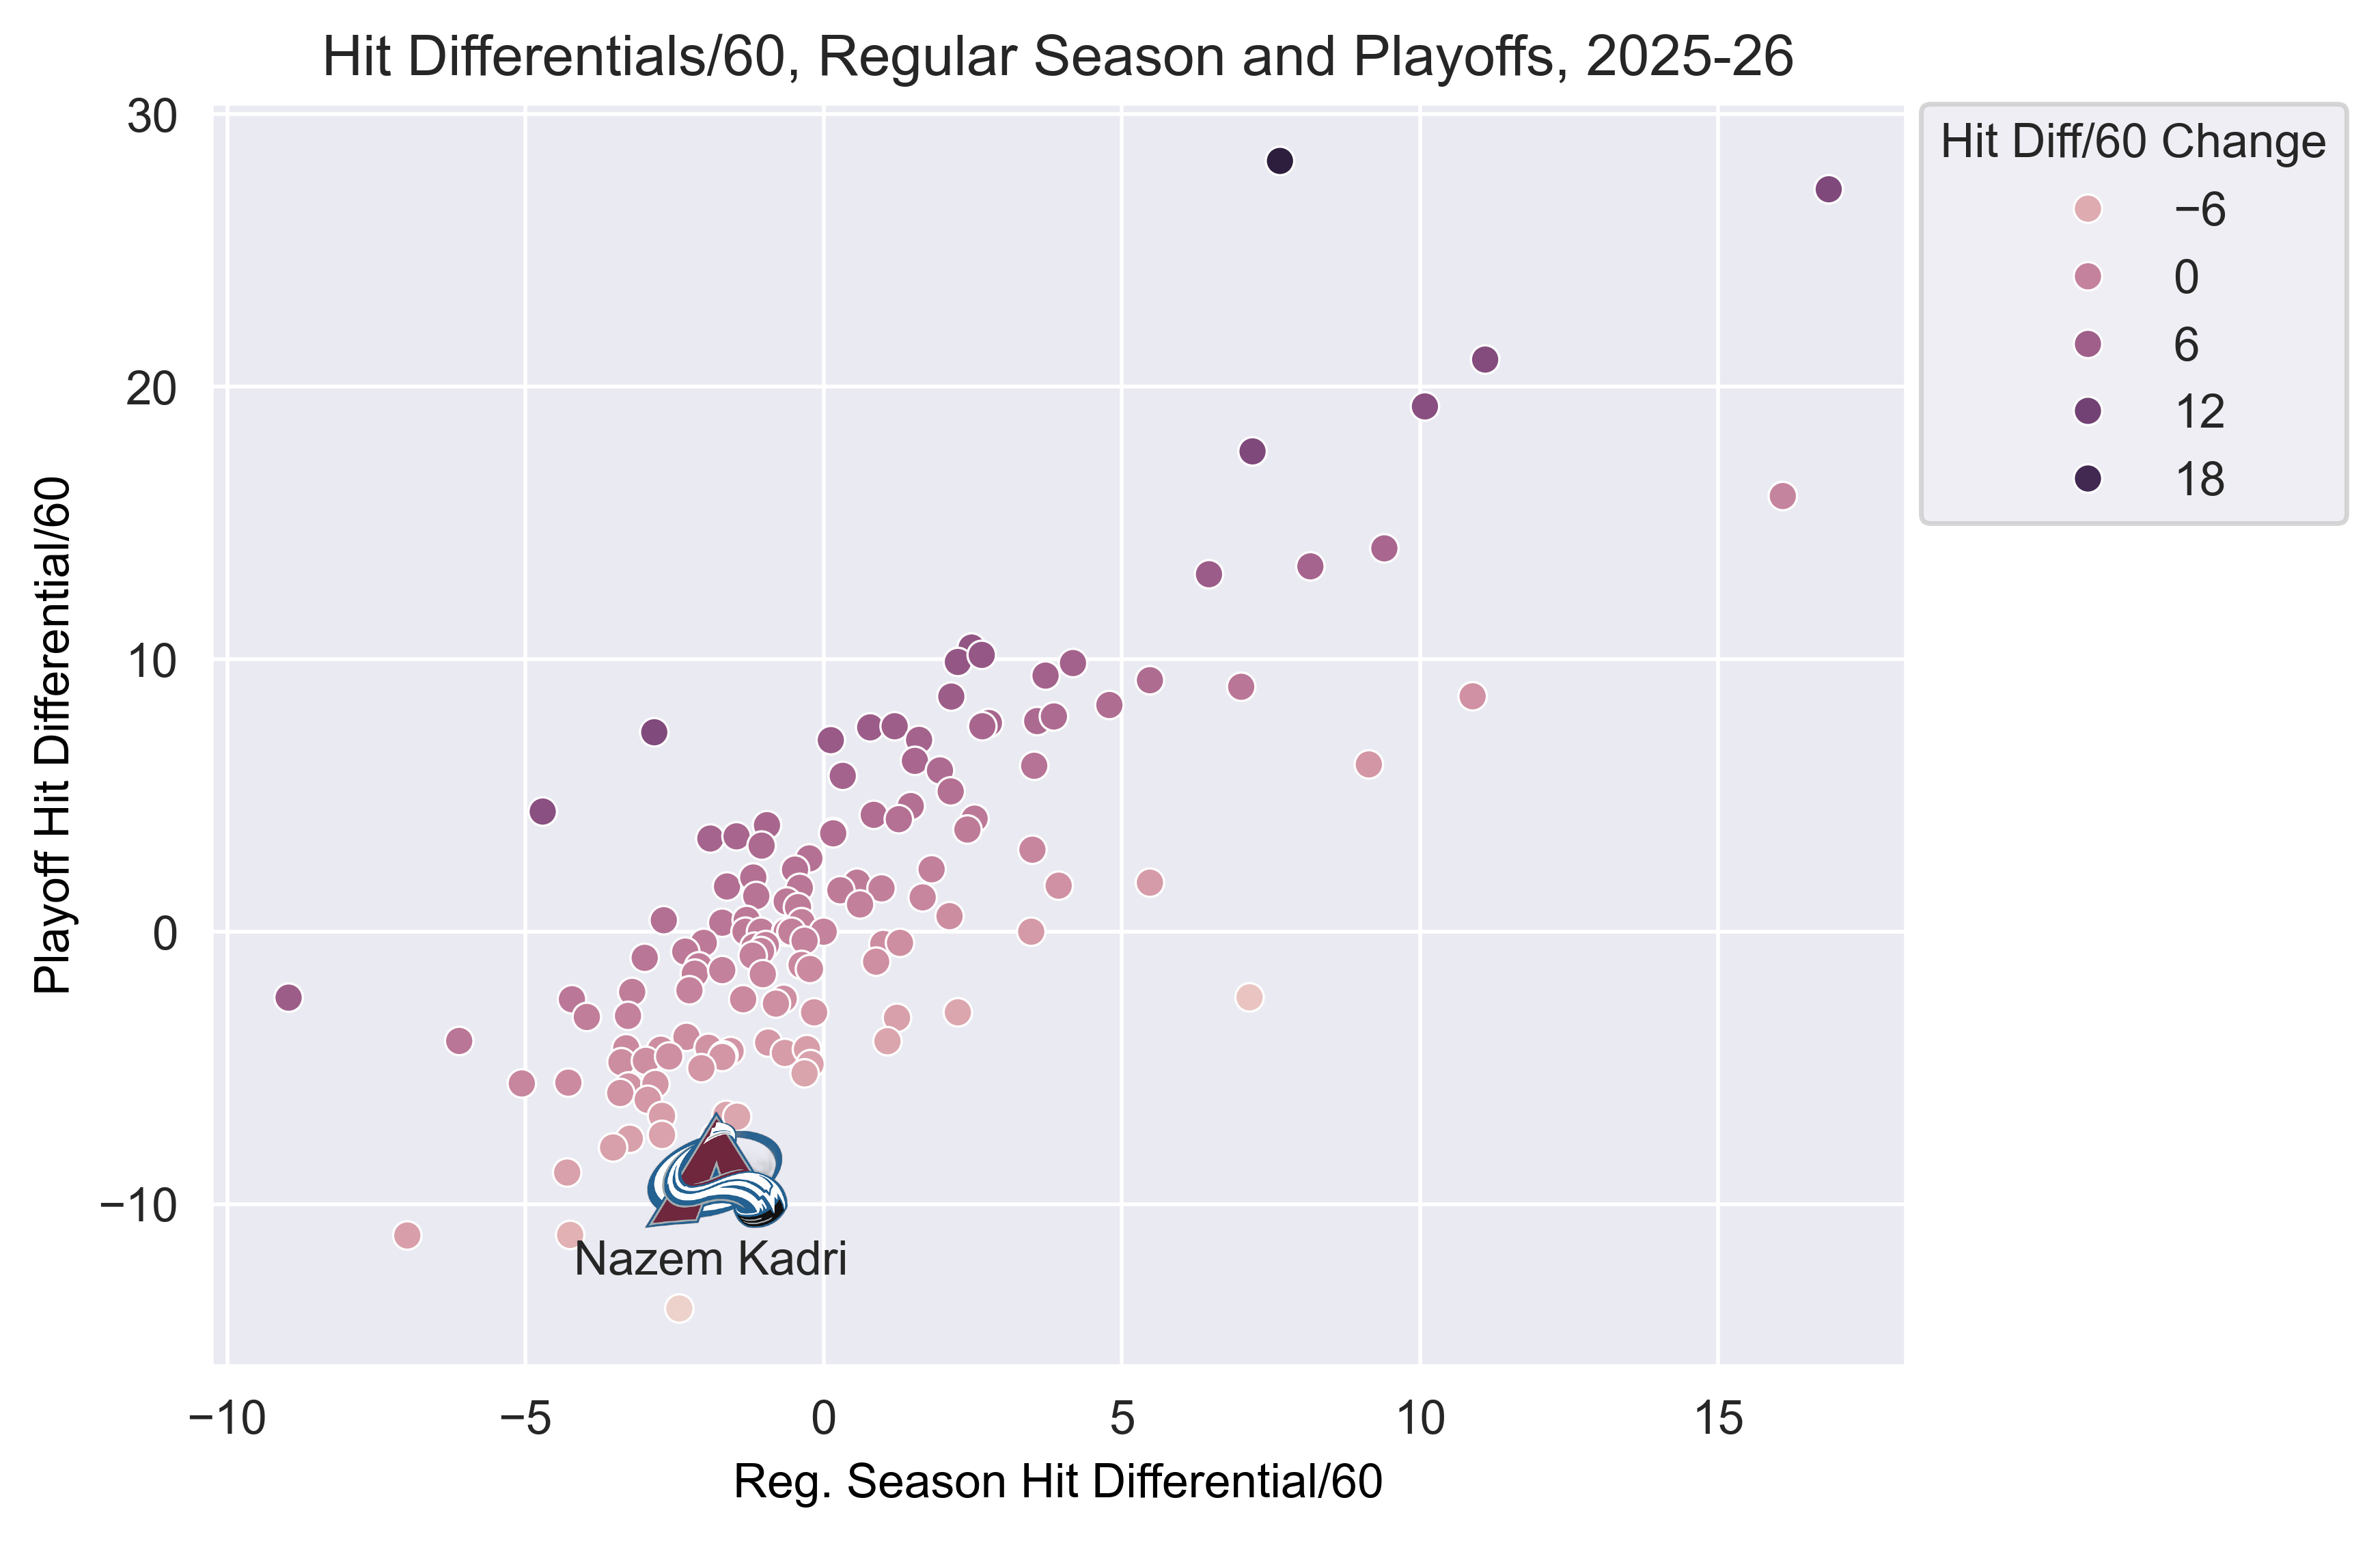
The difference between Kadri and Stanley is that Colorado has controlled 60% of the shot attempts with Kadri on the ice – he is getting hit a lot more because his team often has the puck when he’s on the ice. That is a trade-off that the team will take.
10 – Uncle John
Going back to the Anaheim/Vegas series, Ducks defenceman John Carlson has also seen a sizeable decline in his hit differential, as it has grown from about -1.8 per 60 minutes in the regular season to -7.5 in the playoffs:
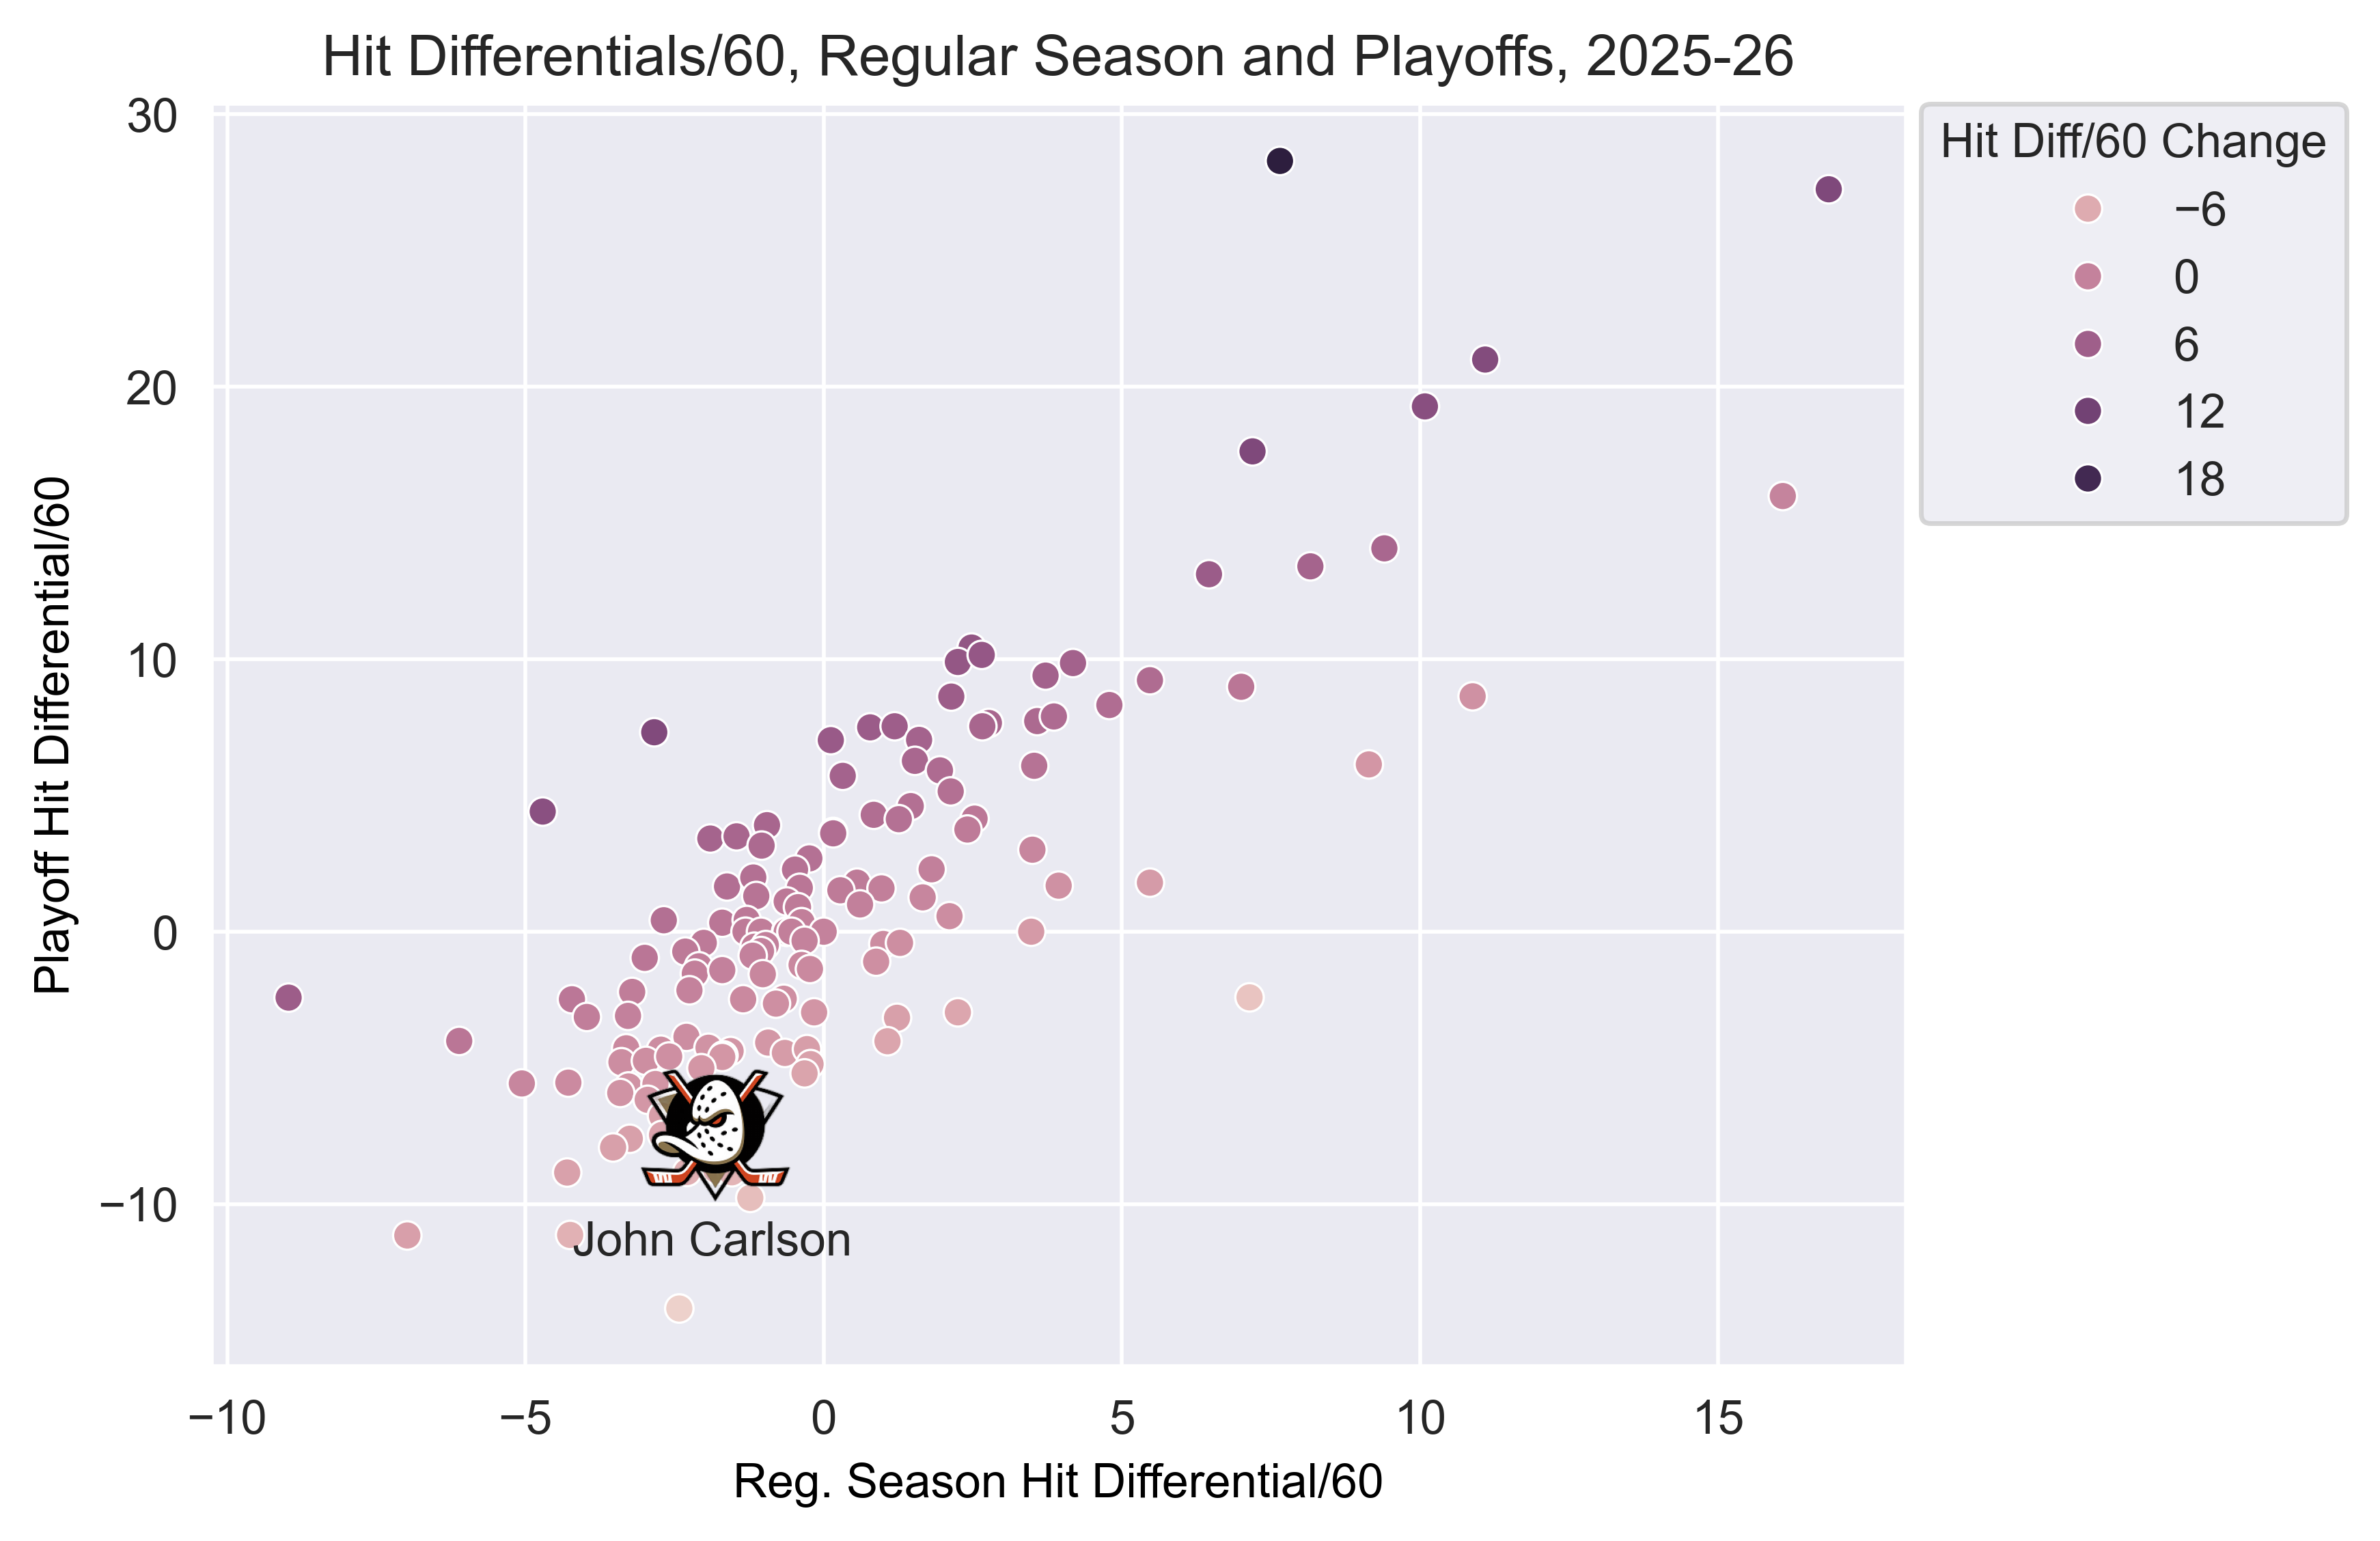
As with Kadri, Anaheim is controlling the play with Carlson on the ice (57% shot attempt share), so that he’s getting hit a lot more makes sense. The goal differential isn’t there yet, but he has a 65% shot attempt share in the series against Vegas, and if that continues, the goals should come, and the team would love to trade hits for goals any day.
Until next week.