10 Interesting (To Me) Stats For This Week - January 27
Welcome back to another week of ’10 Interesting (To Me) Stats’! This column often focuses on 5-on-5 play, and the reasons are 5-on-5 play is where the biggest ice-time sample comes from, and that’s where a lot of tracking data comes from. In general, my writing about special teams lags far behind 5-on-5, so let’s change things up.
Today’s column will look at one key tracking stat that matters for goal scoring. The tracking data comes from All Three Zones and individual/team goal data comes from Evolving Hockey. All data is current as of the morning of Sunday, January 25th, and all of this is for 5-on-4 power plays only.
1 – It Follows
The one key tracking stat that I’ve found helpful describing what has led to goals is scoring chance setups per zone entry. That is simply how many scoring chances a player (or team) sets up when a player (or team) enters the zone on the power play. If a team has 10 zone entries at 5-on-4, and the players set up 5 scoring chances on those 10 entries, that is a 50% chance setup/entry rate. When looking at the four seasons from 2021-2025, each team’s chance setups per zone entry, and the correlation (r-squared) to each team’s goal-scoring rate, we get a very high number:

If anyone has left their high school math in the dustbin, correlations range between 0-1 with 0.0 being no correlation and 1.0 being a perfect correlation. A correlation of 0.607 when talking about anything in hockey is a very, very high number. So, over those four years, we can feel confident that teams being able to set up the most scoring chances per entry were able to score the most often. It seems obvious, but it’s important to find out for sure.
2 – It Follows, Part Deux
That was the prior four seasons. What about the 2025-26 season? Well, as we might expect, the correlation isn’t as high because we’re looking at about 60% of one season rather than four complete seasons. With that said, the correlation is still 0.217, which is passable for hockey. Importantly, there is a p-value of less than 0.05 (the red box):
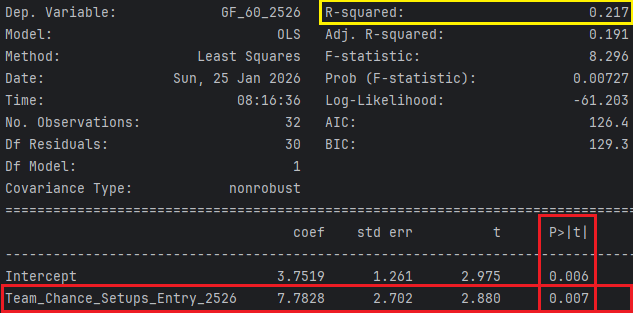
What a p-value tells us is whether the data we’re looking at is statistically significant, or whether it is just random chance. Generally, a p-value under 0.05 means the data is statistically significant, and not random chance, so despite the lower correlation here, we can have confidence that the rate of chance setups per entry still matters for power-play goal scoring in 2025-26.
3 – What-A-Mess
Things get a little bit more complicated when looking at the player level rather than the team/league level. For instance, when just isolating forwards with at least 90 minutes of 5-on-4 power-play time, we still get a positive correlation between their individual rate of chance setups on their zone entry and their team’s goal-scoring when that player is on the ice, but there is a wide array of results:
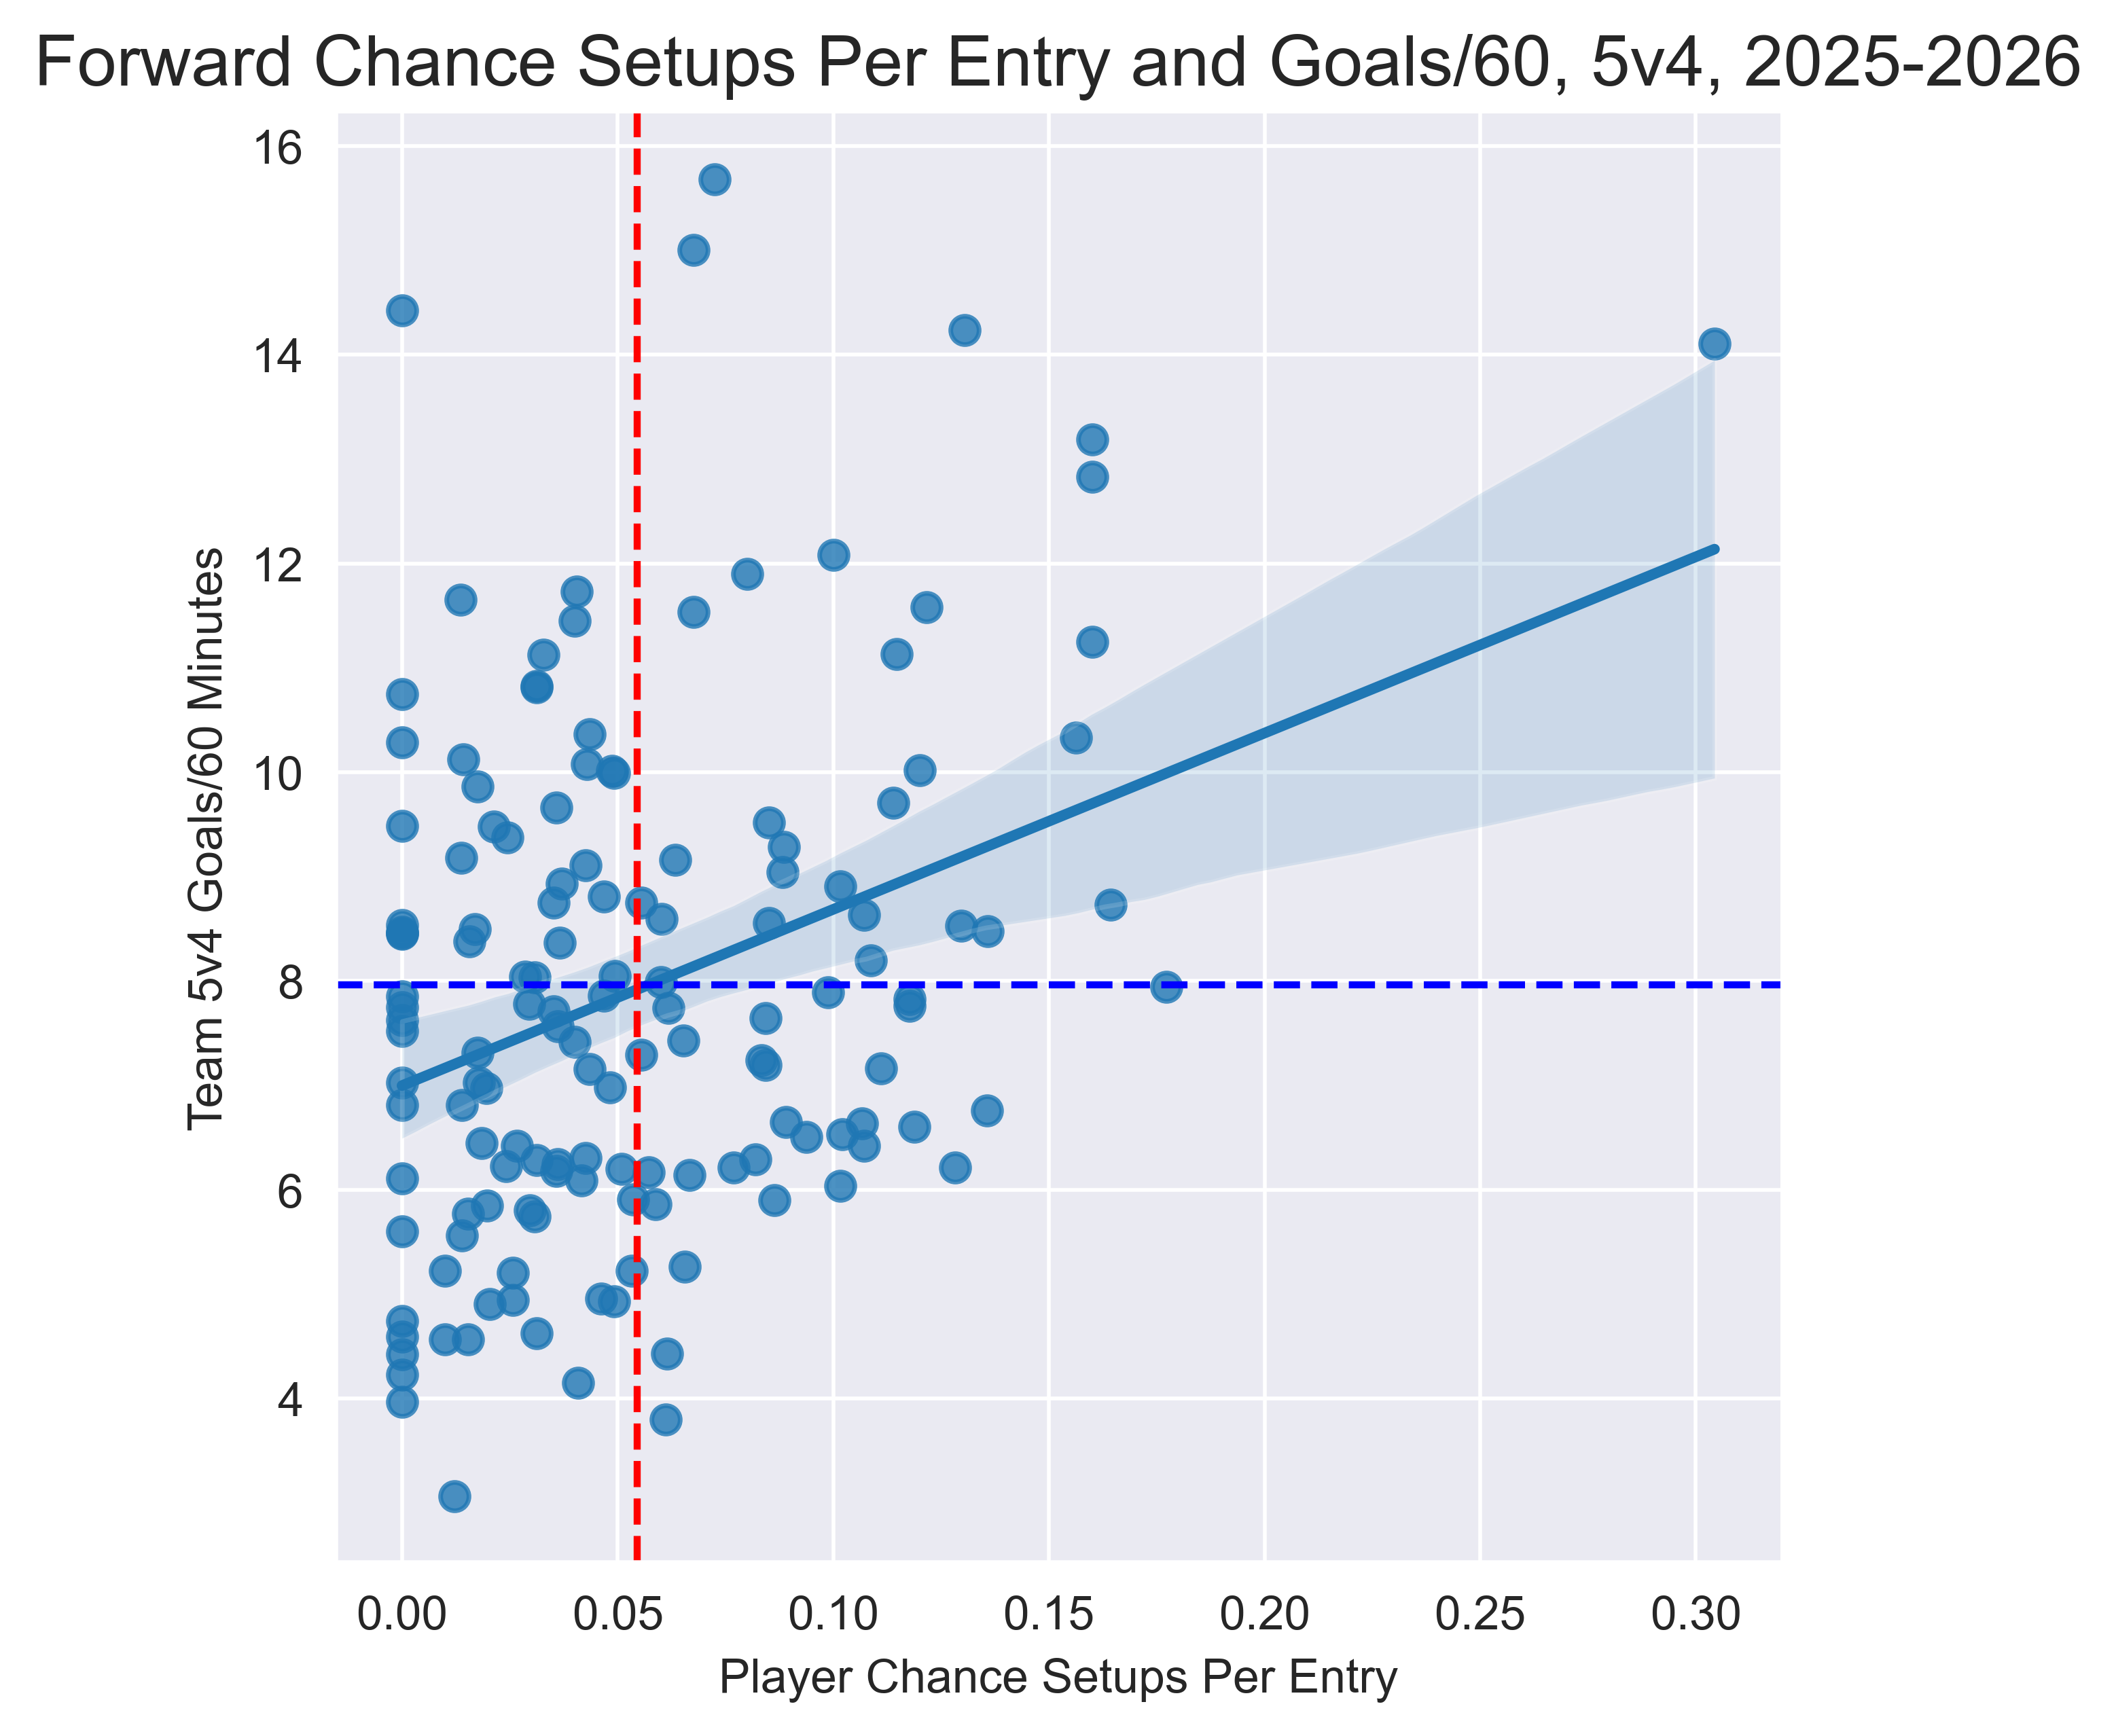
We see a whole slew of players ranging from 0-0.1 chance setups per entry all across the goal-scoring spectrum, but things start improving once we get past the 0.1 chance setup/entry rate – the forwards over 0.1 chance setups per entry have a team goal-scoring rate about 15% higher than league average.
4 – Cooking Pasta
As of Sunday morning, the Boston Bruins had a top-5 power play in the league by goals per 60 minutes at 5-on-5. It is a drastic turnaround from the 2024-25 season when they finished 29th in the league. This isn’t much of a shock, but the key cog of that top PP unit is superstar winger David Pastrňák:
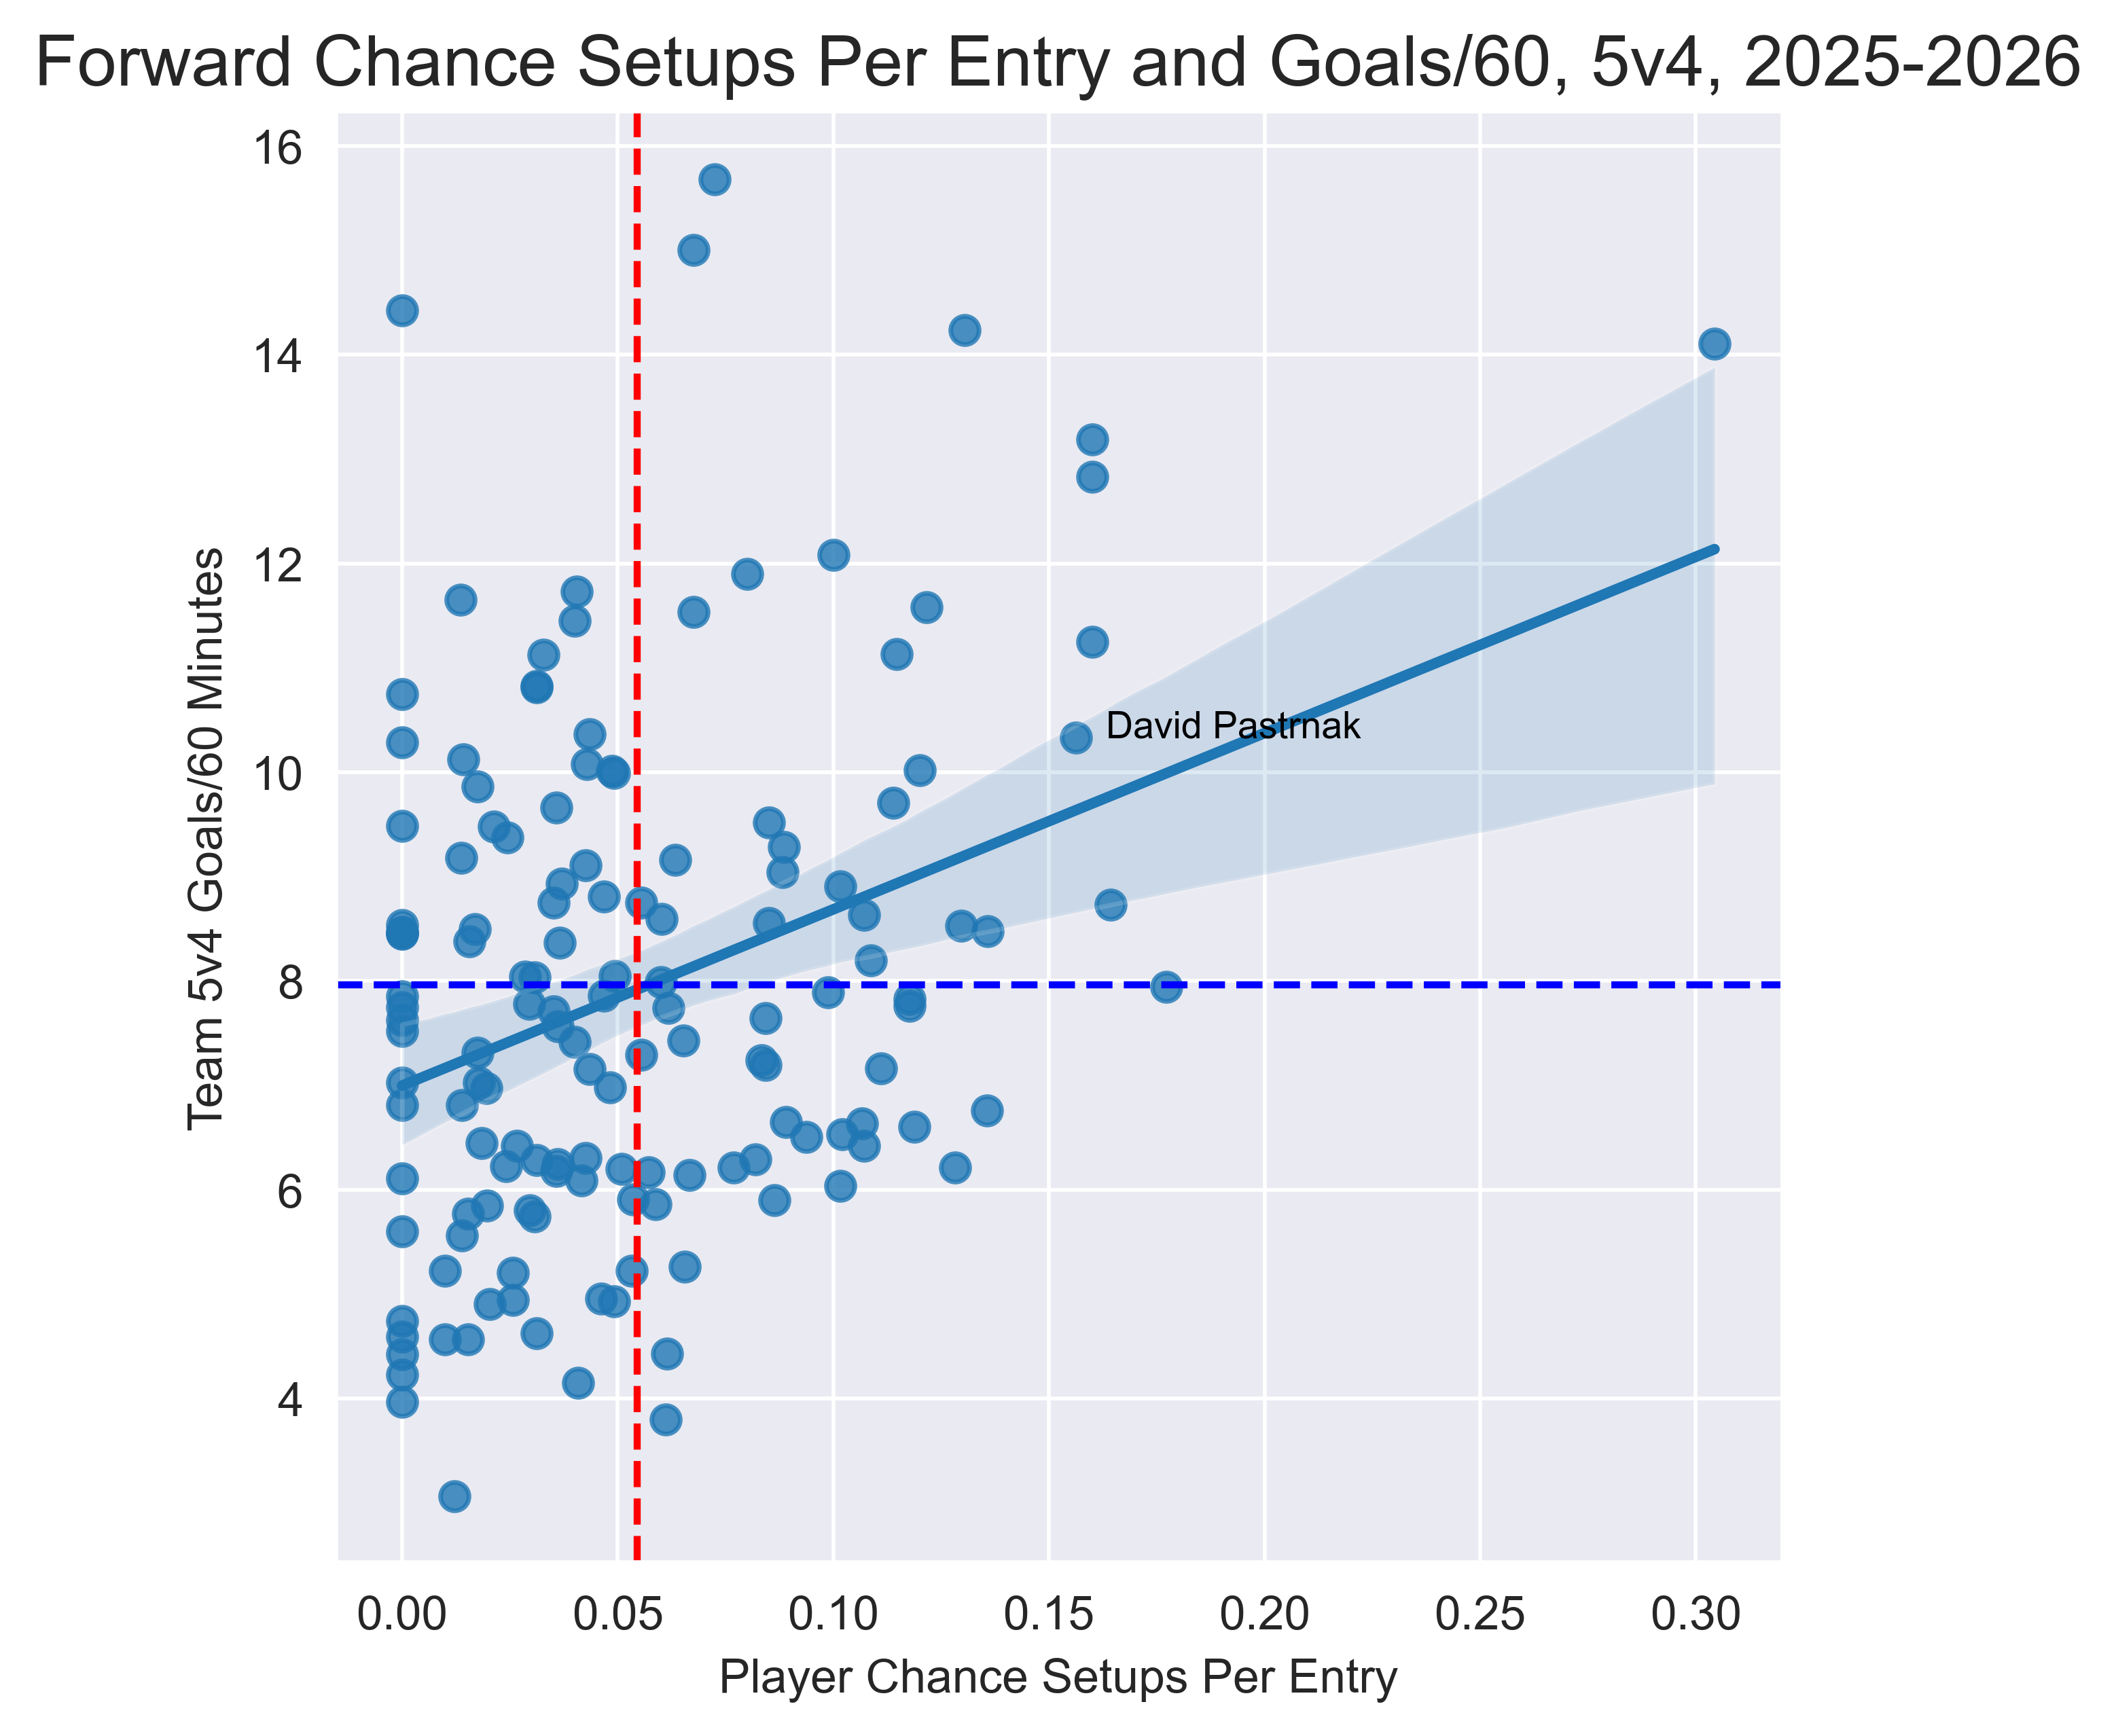
His ranking among all the PP forwards in our sample might not seem impressive, but this is the impressive part: of the four most-used forwards on Boston’s power play – Pavel Zacha, Elias Lindholm, and Morgan Geekie – Pastrňák is responsible for over 70% of the chance setups in the tracking data. He is truly a one-man show in Boston.
5 – Making His Mark
Vegas Golden Knights winger Mark Stone has typically had a huge impact on their power play. This season, the top PP unit’s goal-scoring rate more than doubles when he’s on the ice, and the two seasons from 2023-2025 saw a 63% goal-scoring increase when Stone was in the lineup. It makes sense when looking at his chance setups per zone entry, along with Jack Eichel and Mitch Marner:
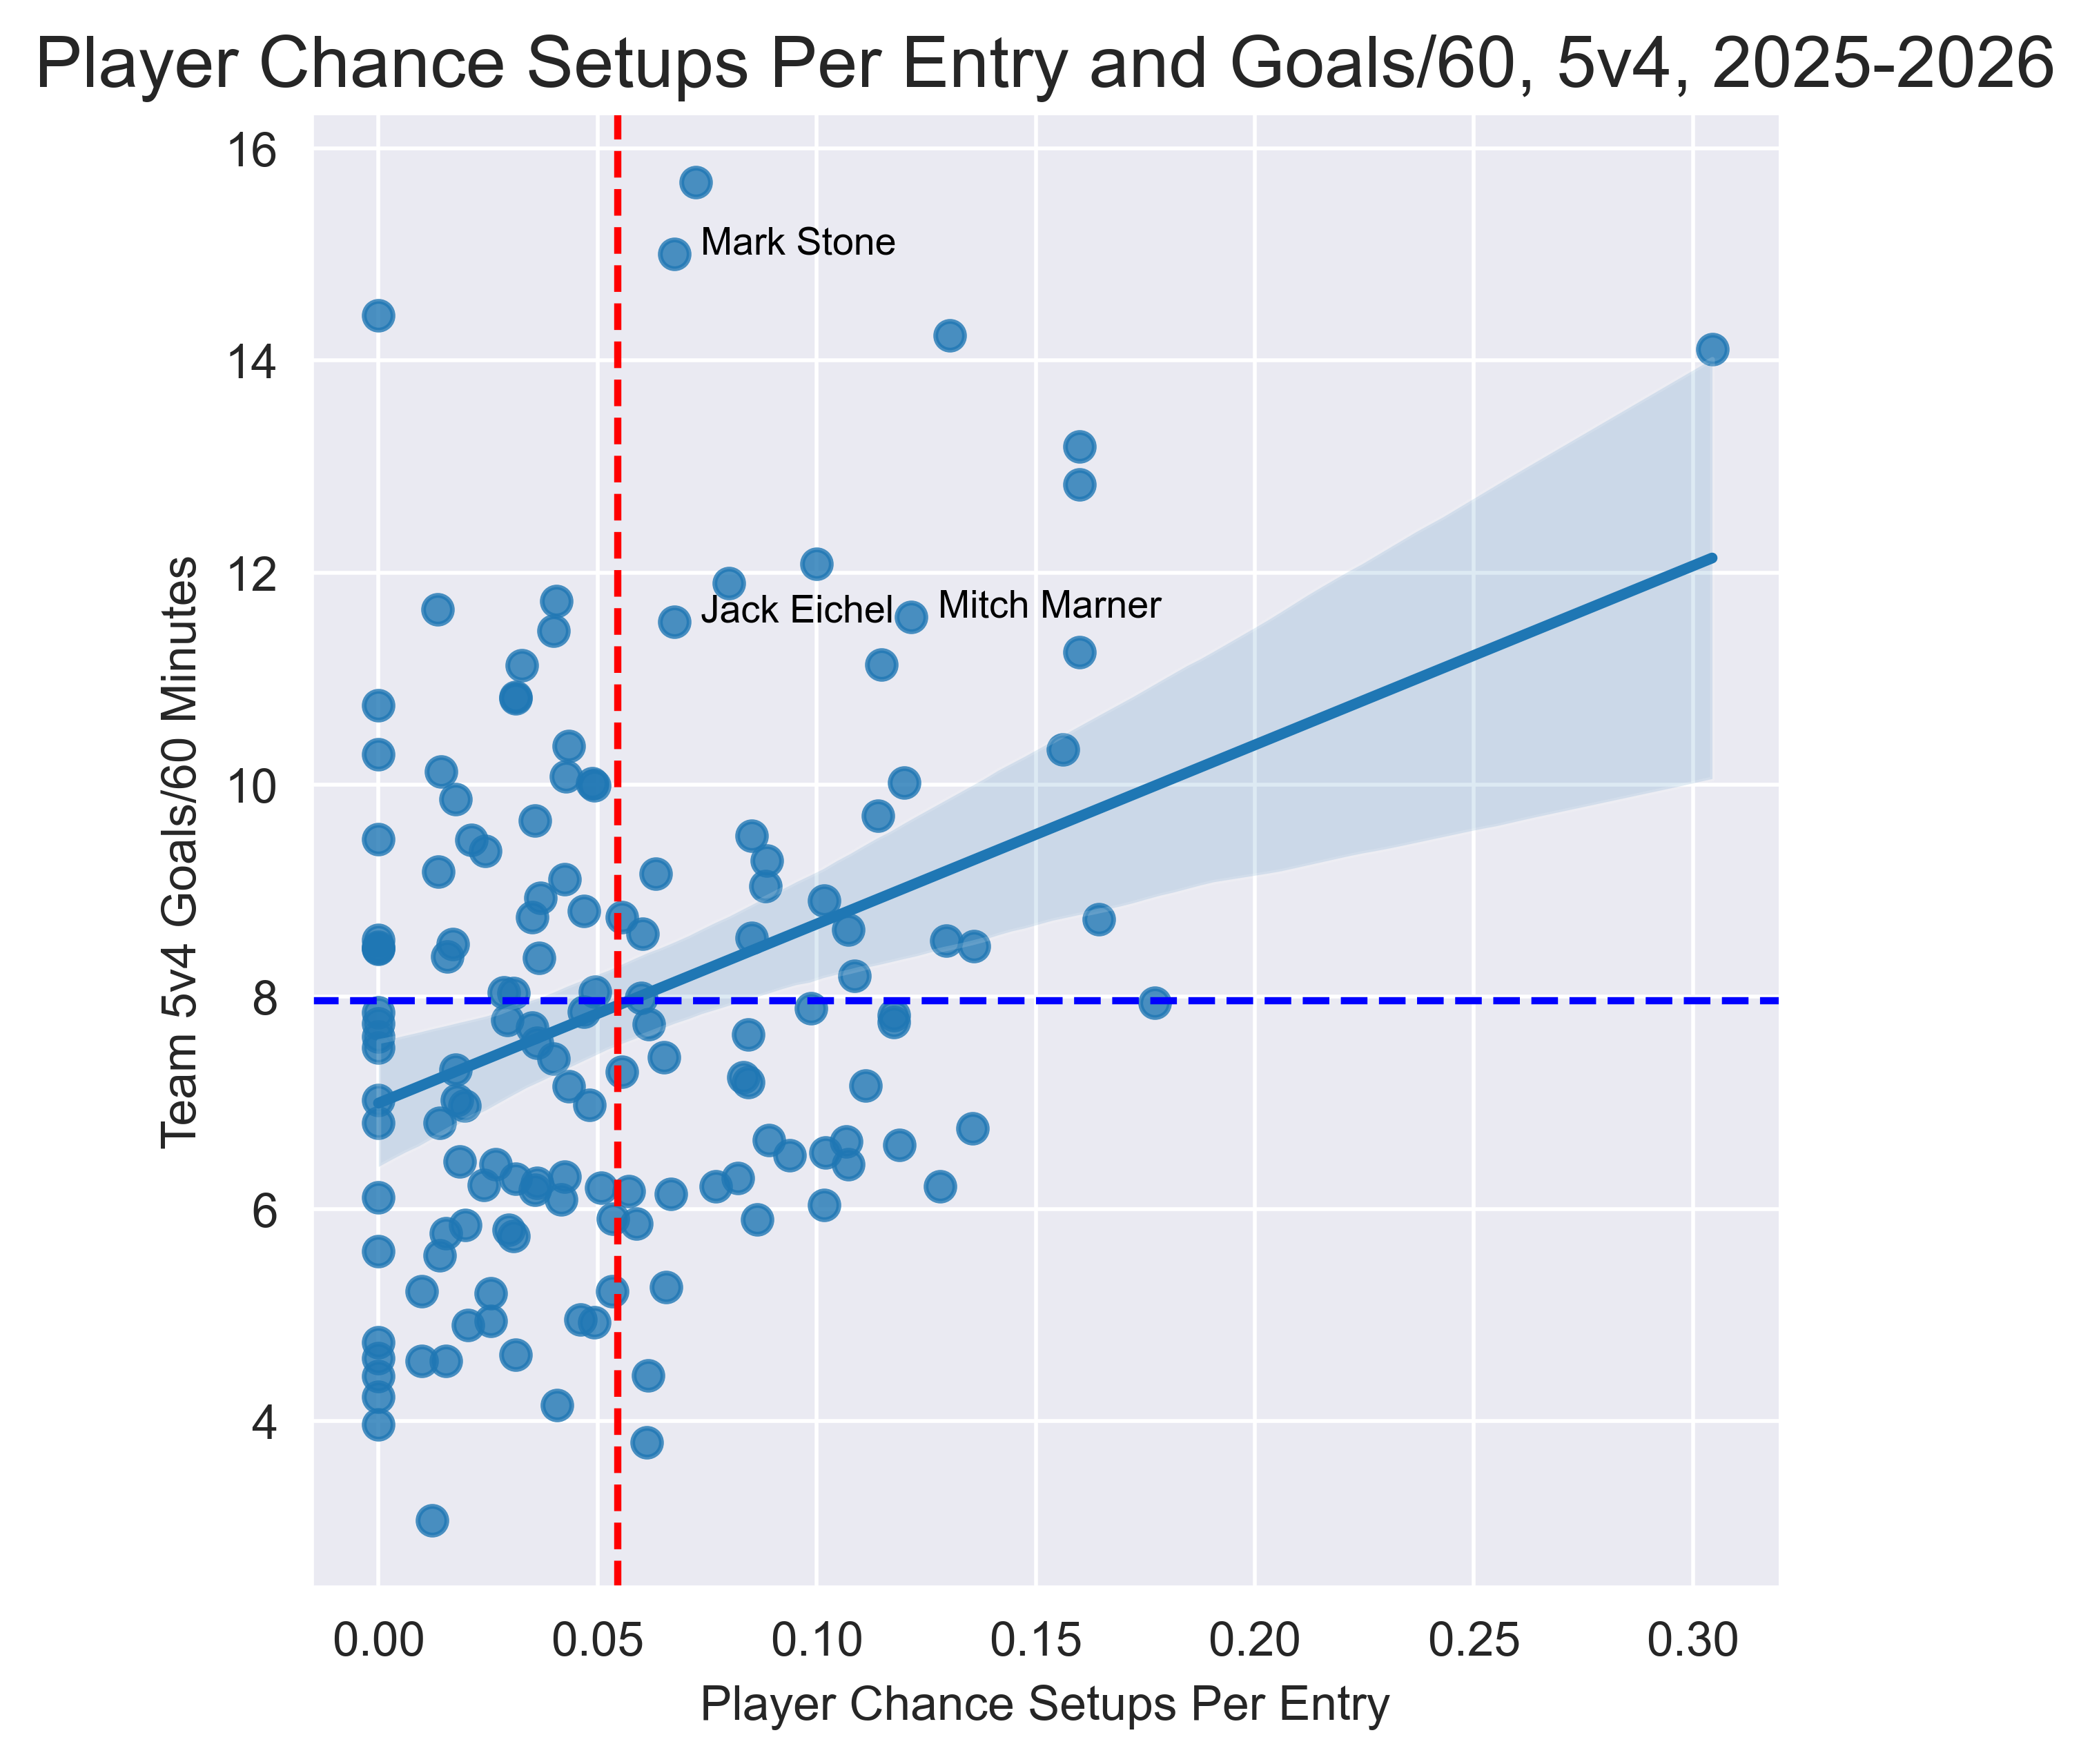
It seems that on a team Jack Eichel that traded for Marner, Stone’s contributions can get overlooked. Considering his stellar 5-on-5 play and penalty kill contributions, he remains, without question, one of the elite wingers in the league.
6 – The Old-New
After a few years of an average-or-worse power plays from 2021-2024, the Pittsburgh Penguins jumped to 7th by goals per 60 minutes at 5-on-4 last season. So far this season, their rate sits at 9.77 goals/60, which is fourth in the league. Leading the way are two future Hall of Famers in Evgeni Malkin and Sidney Crosby:
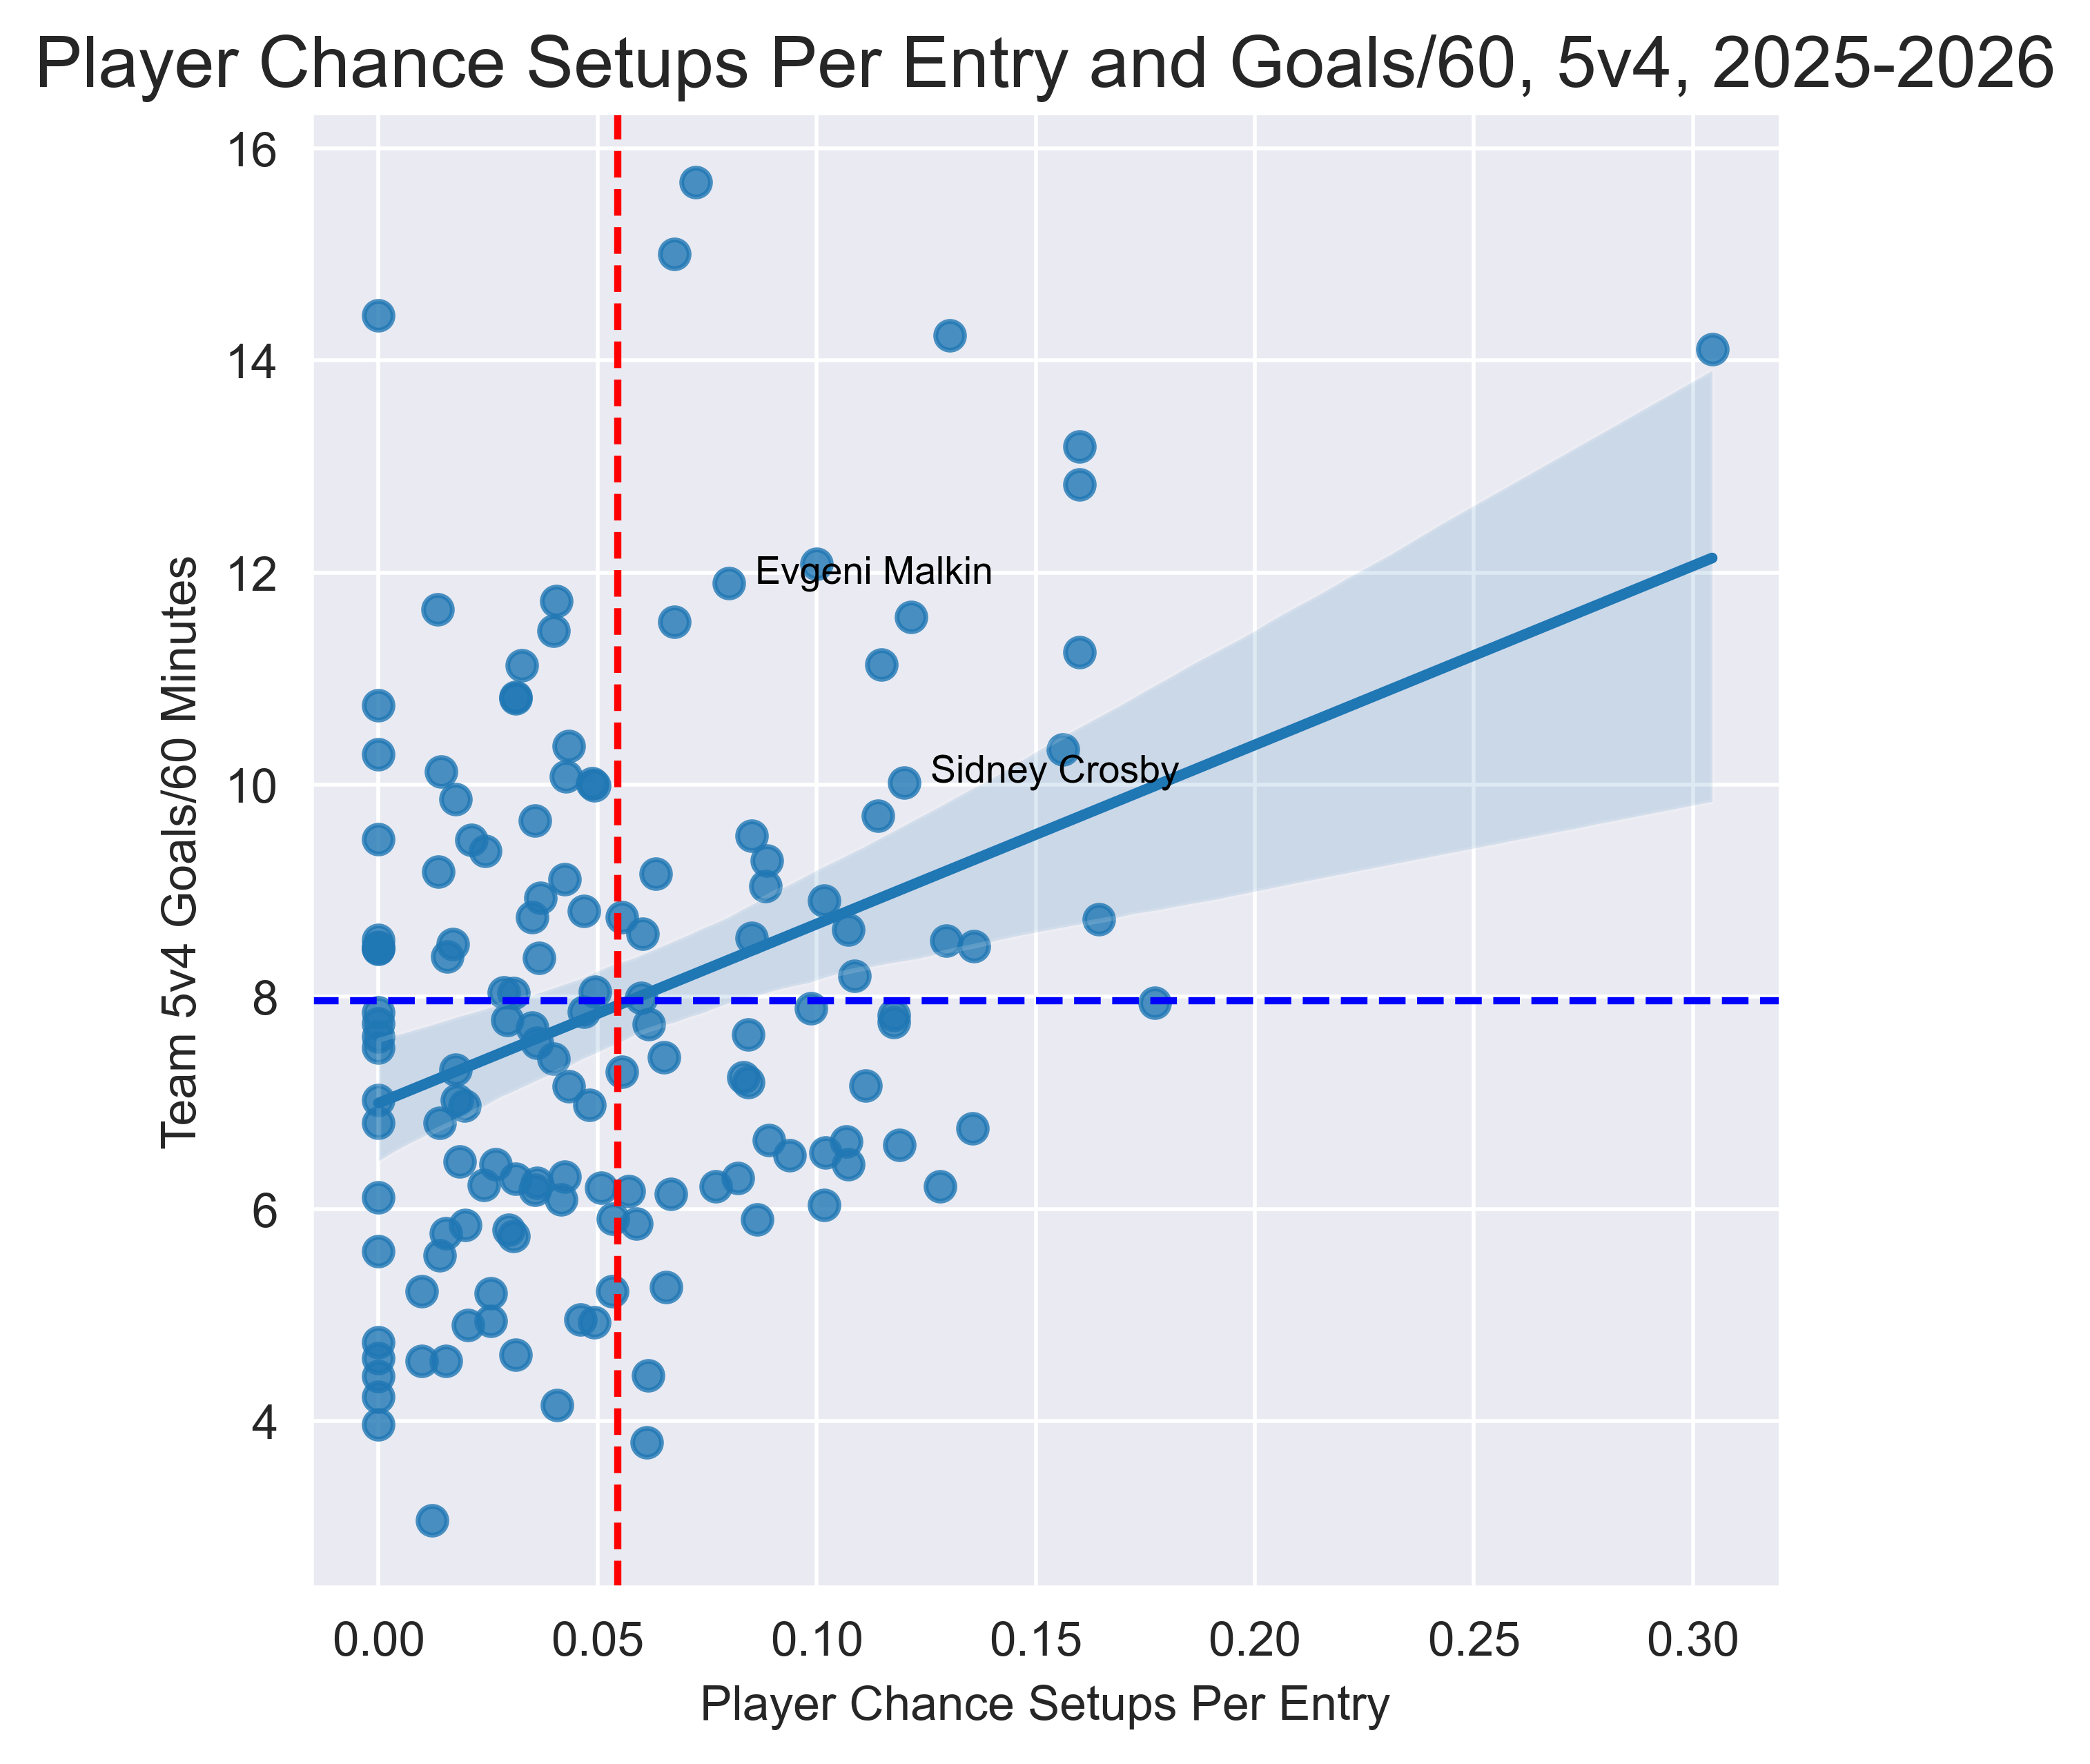
We will talk about defencemen later, but it’s notable that Erik Karlsson’s rate of chance setups per entry sits sixth among blue liners in our sample, which complements what Malkin and Crosby are doing. The Penguins are firmly in a playoff race and while there are a lot of reasons for that, a top-5 power play is certainly a factor, and the never-ending success of the Malkin/Crosby duo is figuring in heavily.
7 – Slick Oil
The 2024-25 season saw the Edmonton Oilers fall outside the top-10 power plays in the league by goals/60 at 5-on-4, but they have regained the top spot in the NHL with a whopping 12.63 goals/60. That is nearly two full goals higher than the next-closest team, and you can probably guess who is responsible for this:
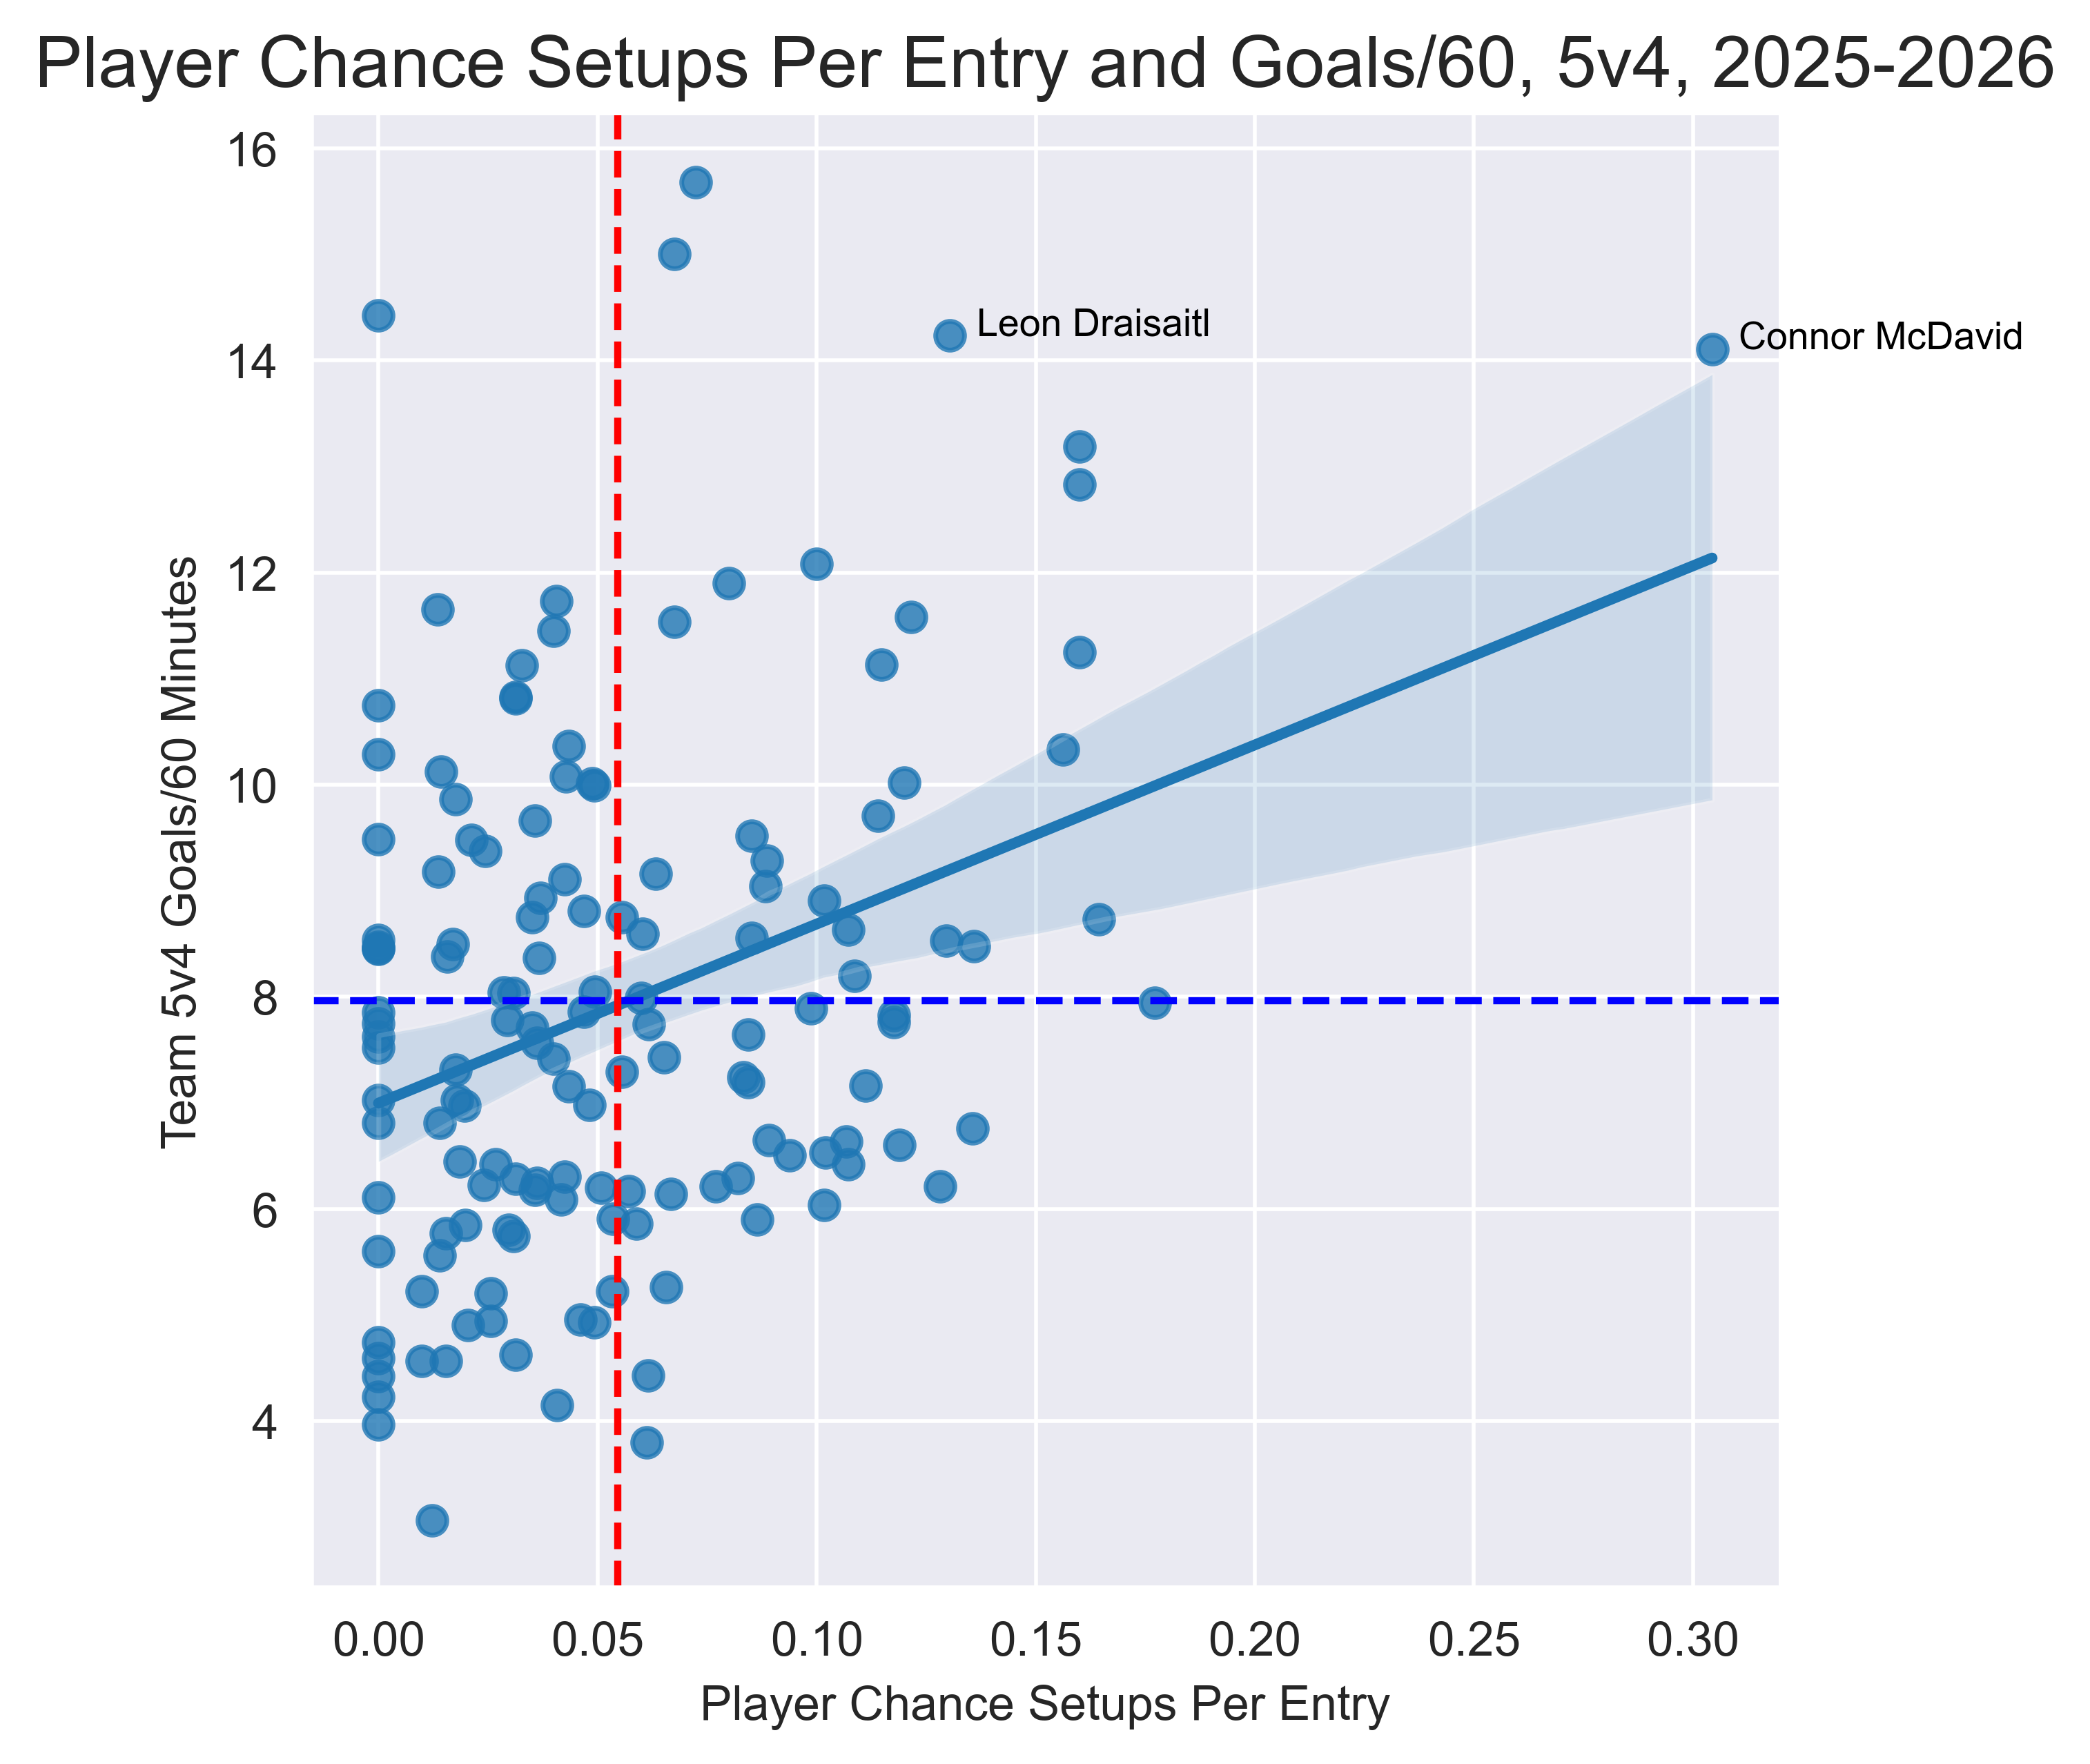
The funny part is that Leon Draisaitl is among the top-10 forwards by chance setups per zone entry, but Connor McDavid is quite literally in another tier from anyone else. It isn’t a huge surprise that McDavid leads the way, but that his rate of chance setups per zone entry (0.3) is over 70% higher than the next-closest player (Patrick Kane) is truly astonishing. When it comes to the power play, it’s Connor McDavid and then everyone else.
8 – The Turnaround
With Wyatt Johnston, Jason Robertson, and Roope Hintz on the ice for the power play in 2024-25, Dallas scored 8.9 goals per 60 minutes. So far in 2025-26, with those same three on the ice, Dallas is scoring 13.4 goals per 60 minutes. The difference? You can probably guess:
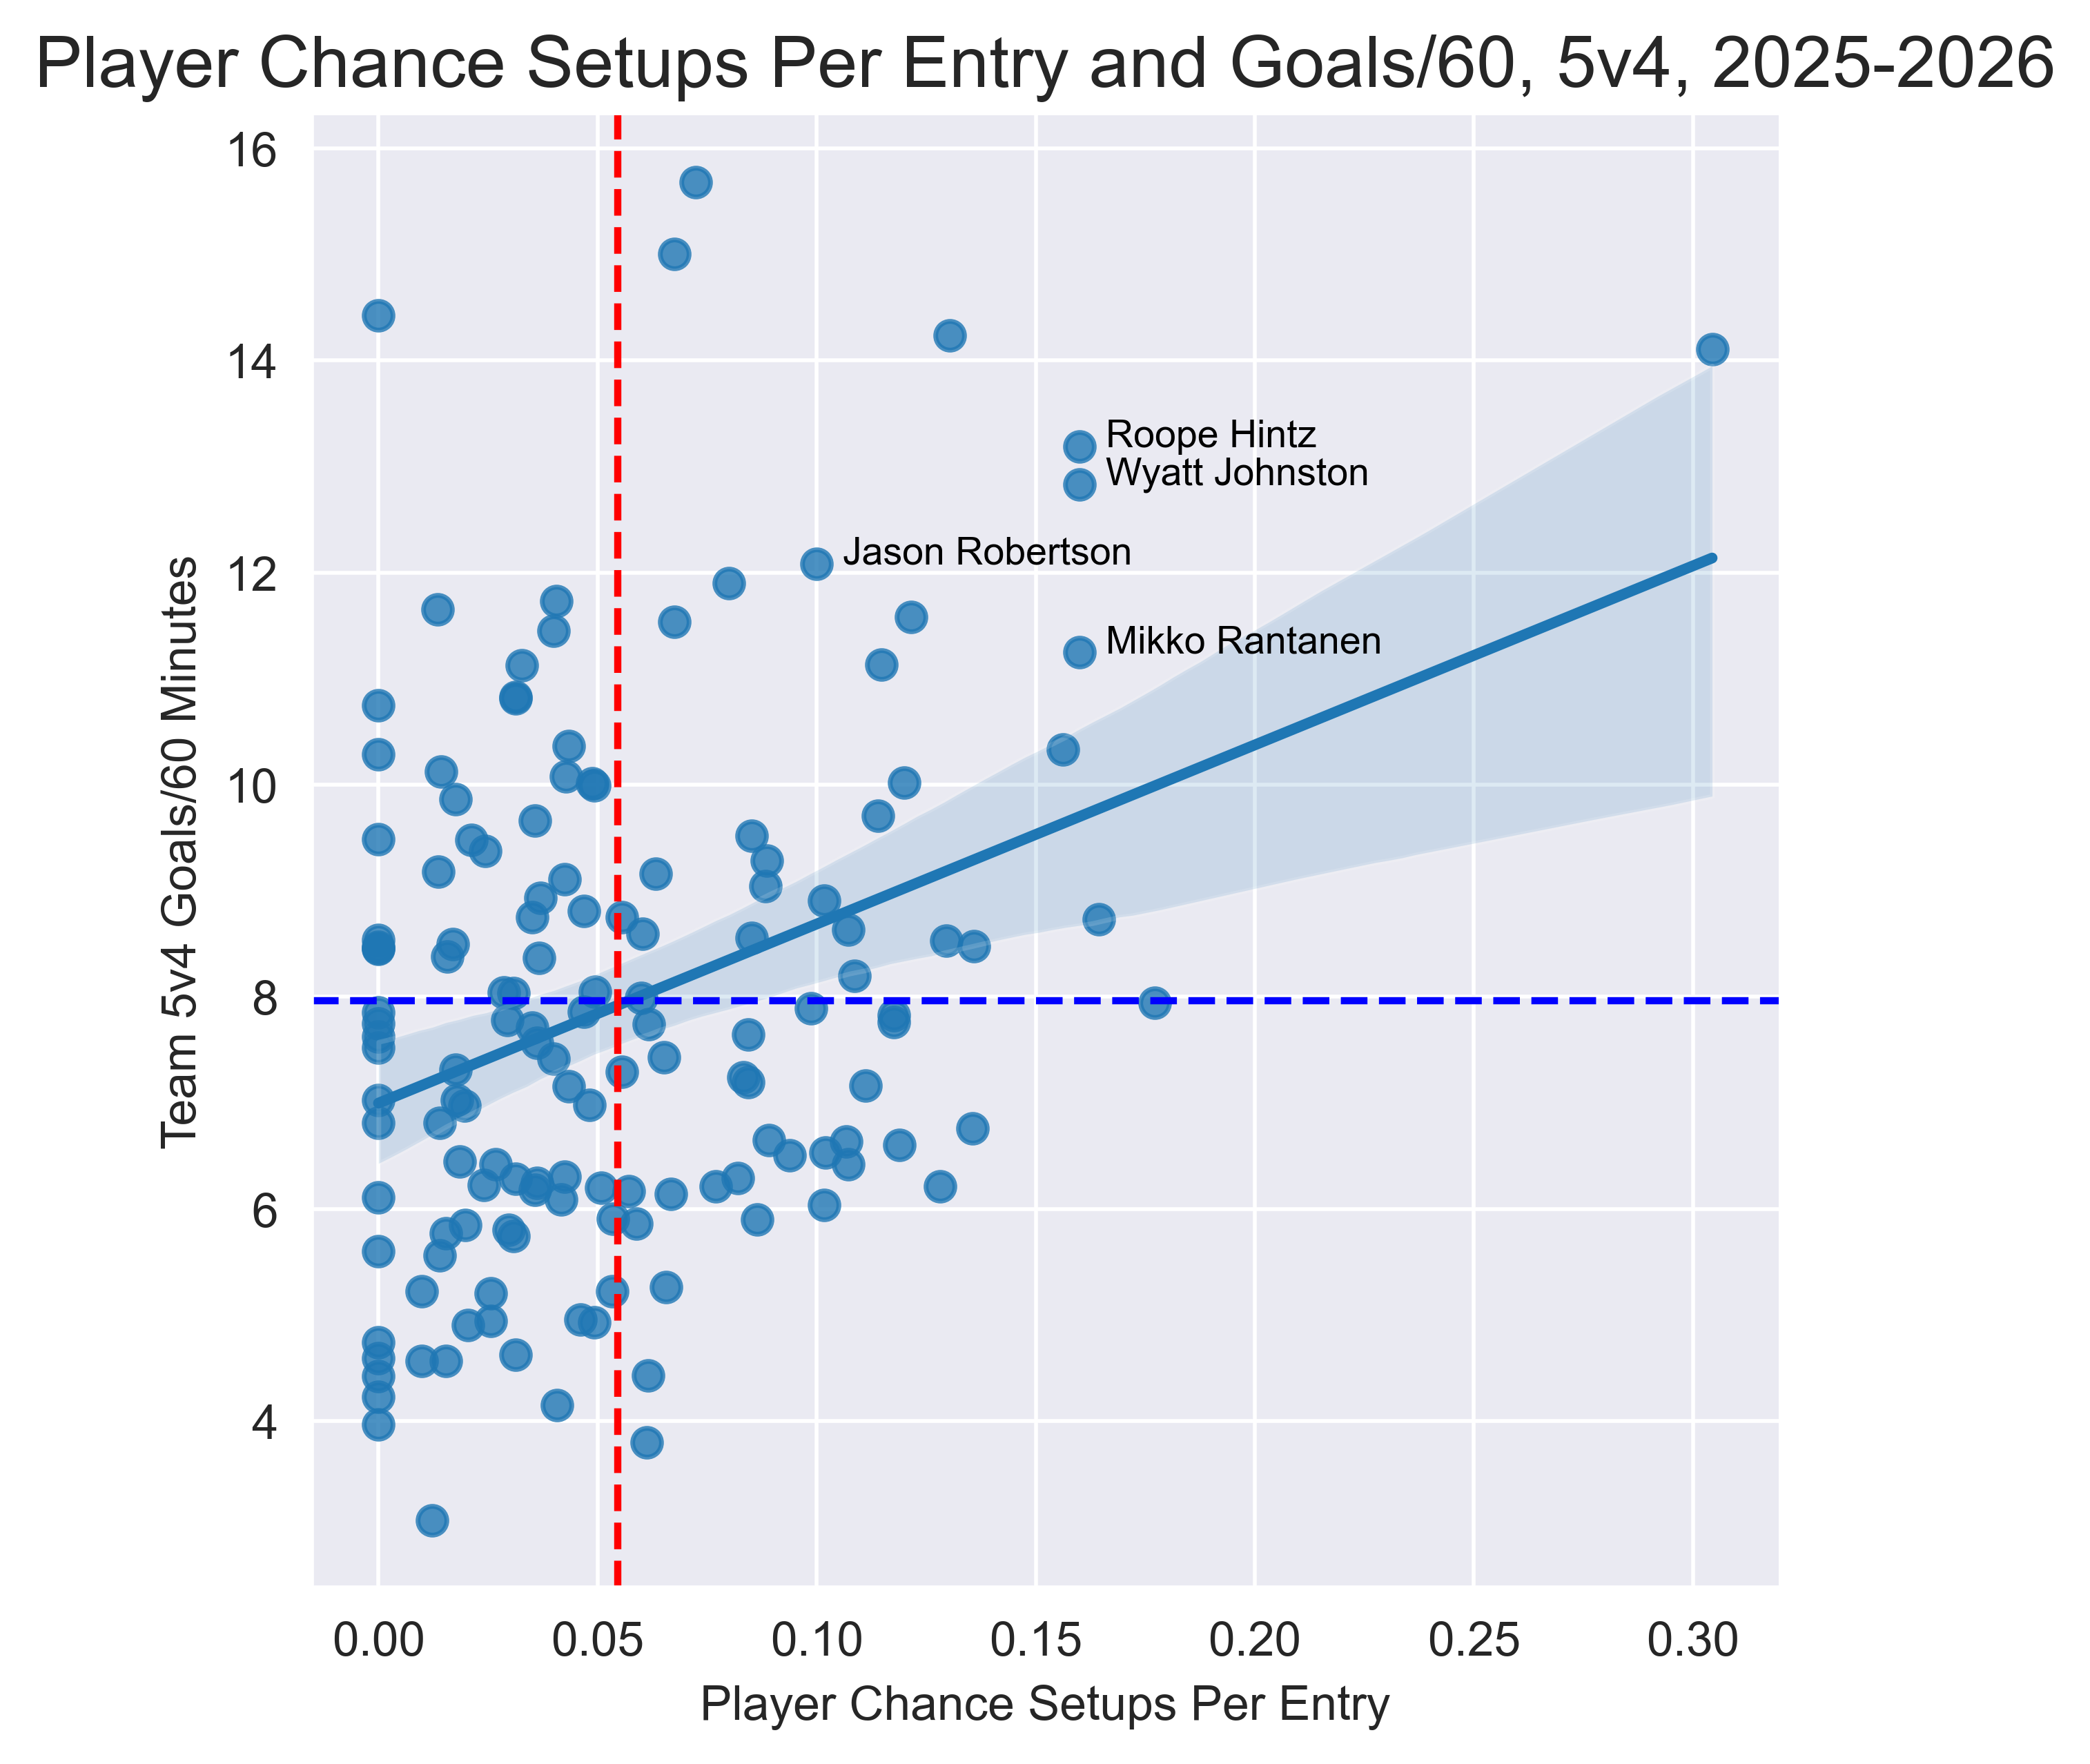
Given how good Dallas’ power play has been this season, it’s not much of a surprise to see all four of their top PP options have such high rates of chance setups per entry. But adding Mikko Rantanen to that quartet is what makes them truly dangerous – every single player can both score themselves and create for others. Good luck to their opponents.
9 – Not the Same
To this point, we’ve only looked at entire teams or just forwards. The reason is that the high correlations at the team level, and passable correlations among forwards, does not exist among defencemen. At least, in the 2025-26 season it doesn’t exist, as there is no relationship between a defenceman’s rate of chance setups per zone entry and the team’s PP goal scoring rate:
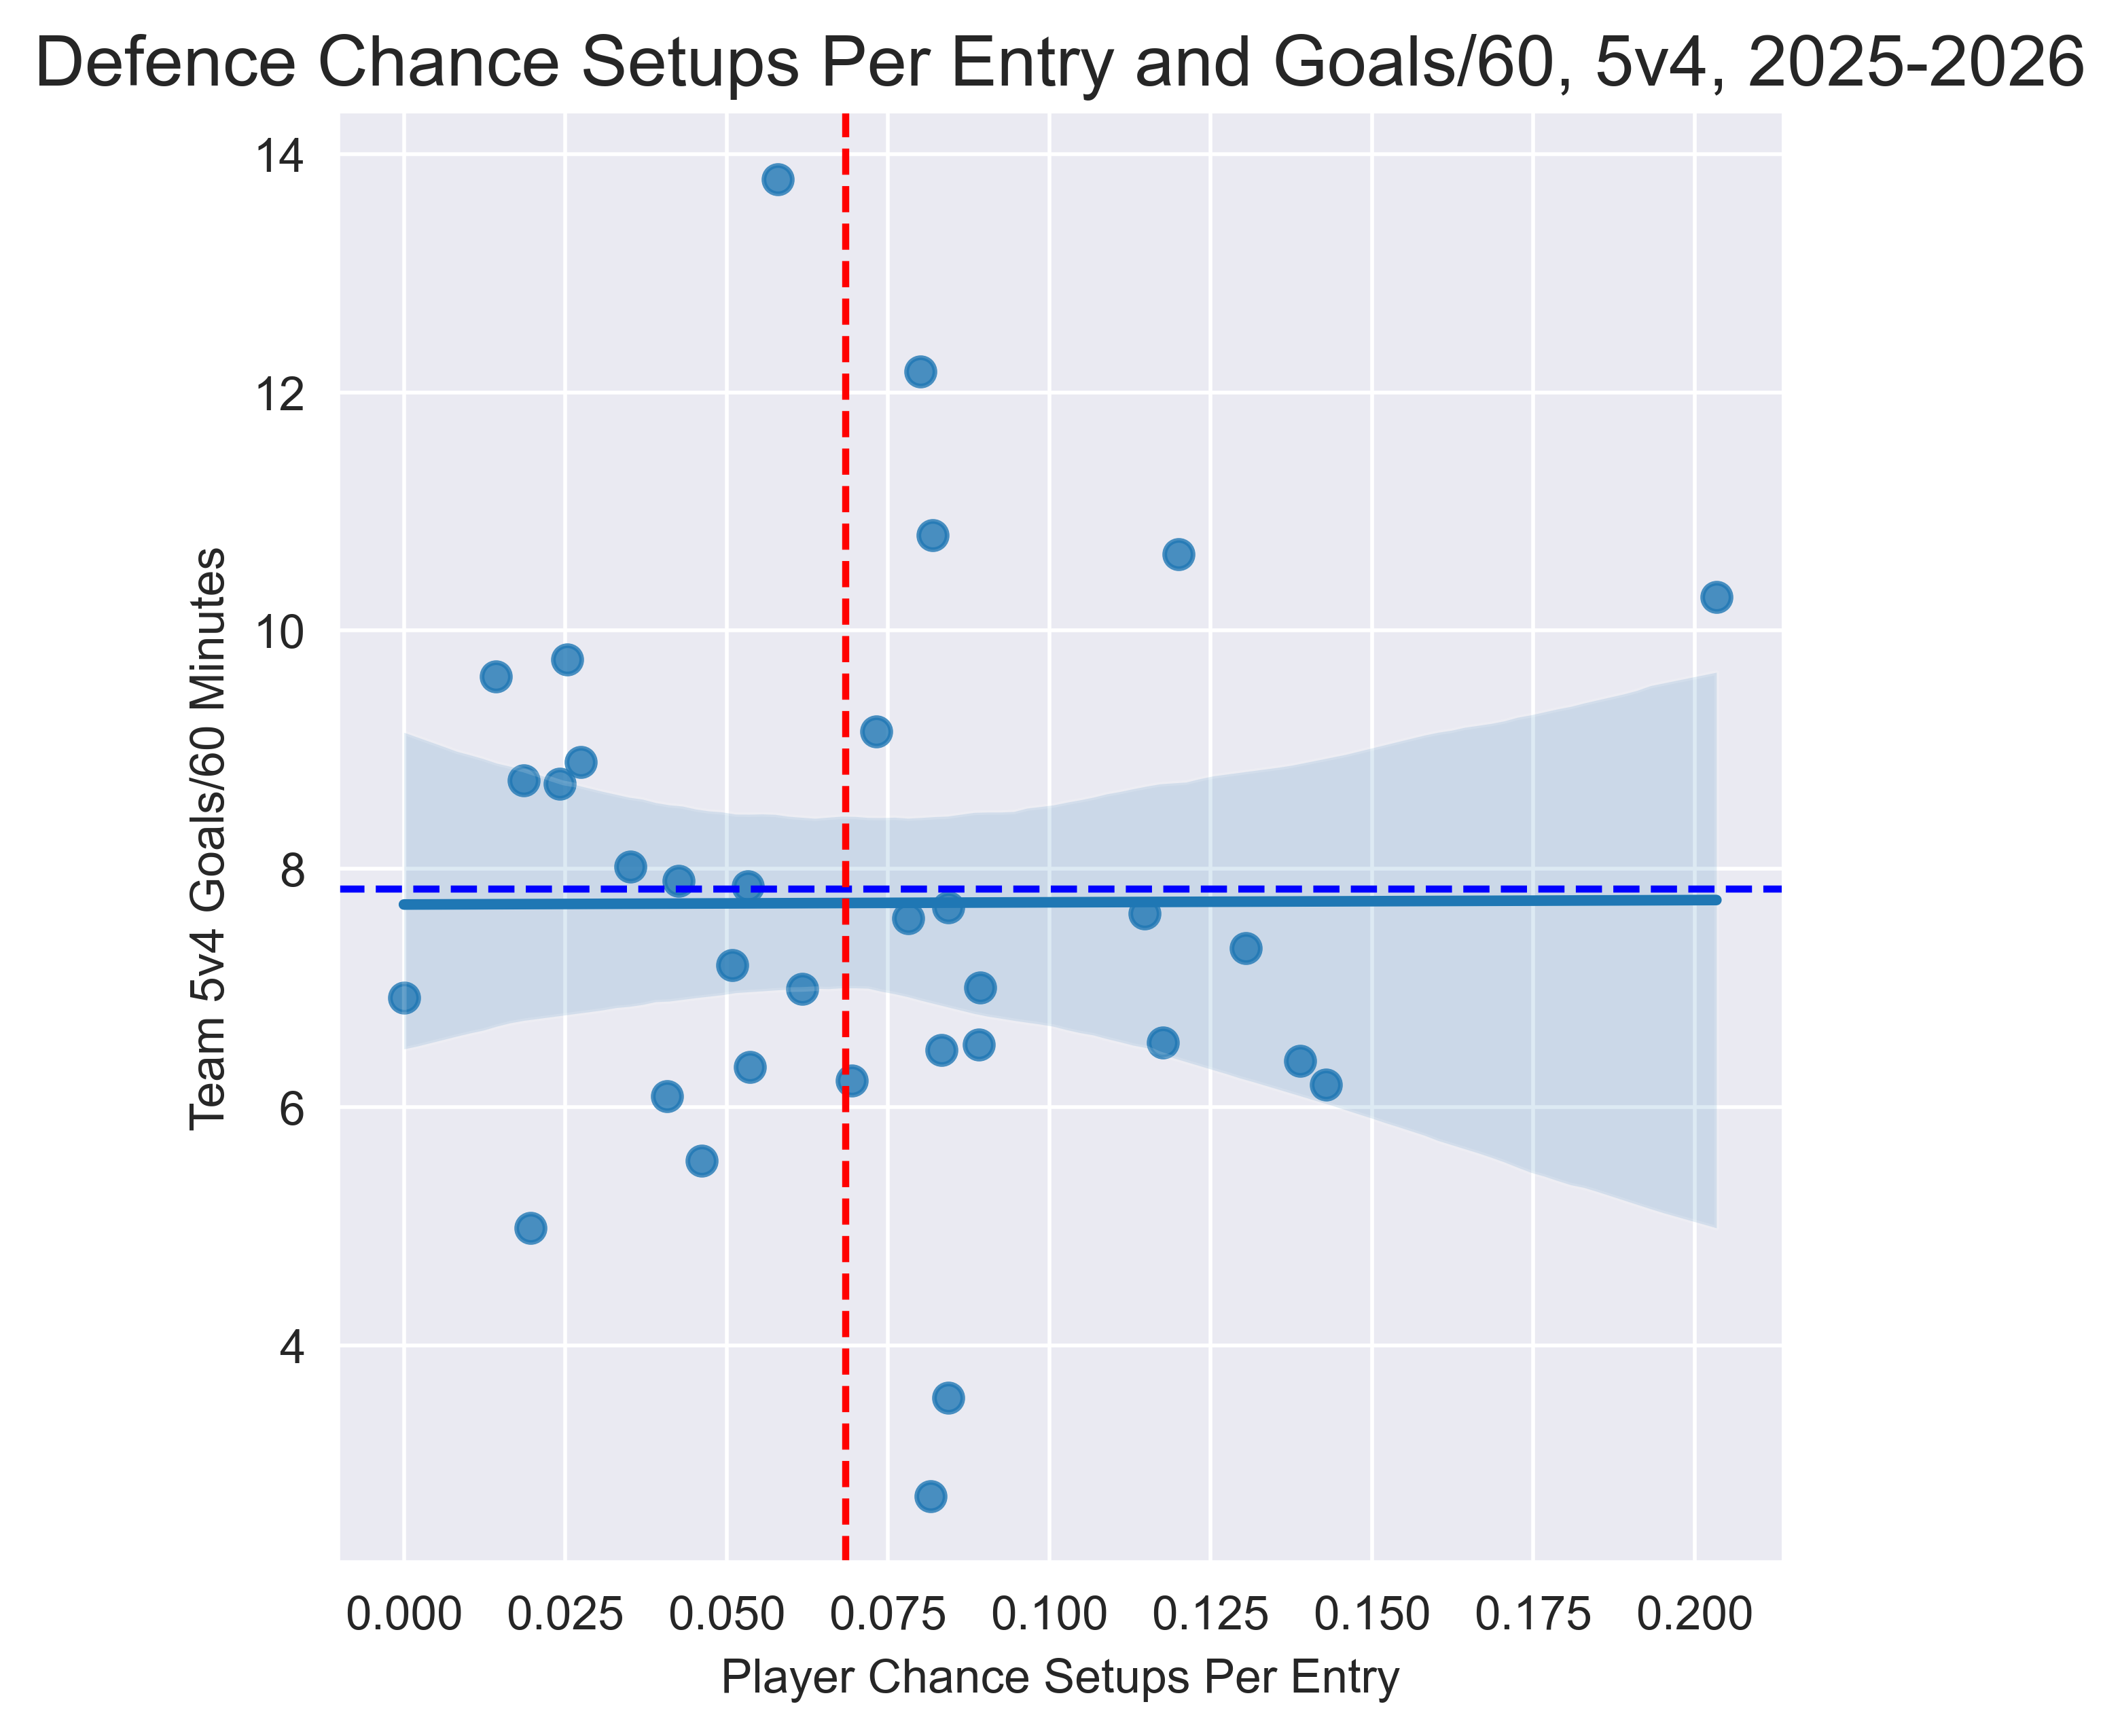
Of the seven defencemen with at least 0.1 chance setups per zone entry on the power play this season, five of them have a team goal-scoring rate that is worse than league average. One exception is Karlsson, whom we mentioned earlier, the other we’ll get to in a second. The rest? Not helping, fellas.
10 – He’s Not Elite?
Which defenceman is the one way ahead of everyone else in terms of chance setups per zone entry and also has a high team goal-scoring rate with them on the ice? Glad you asked:
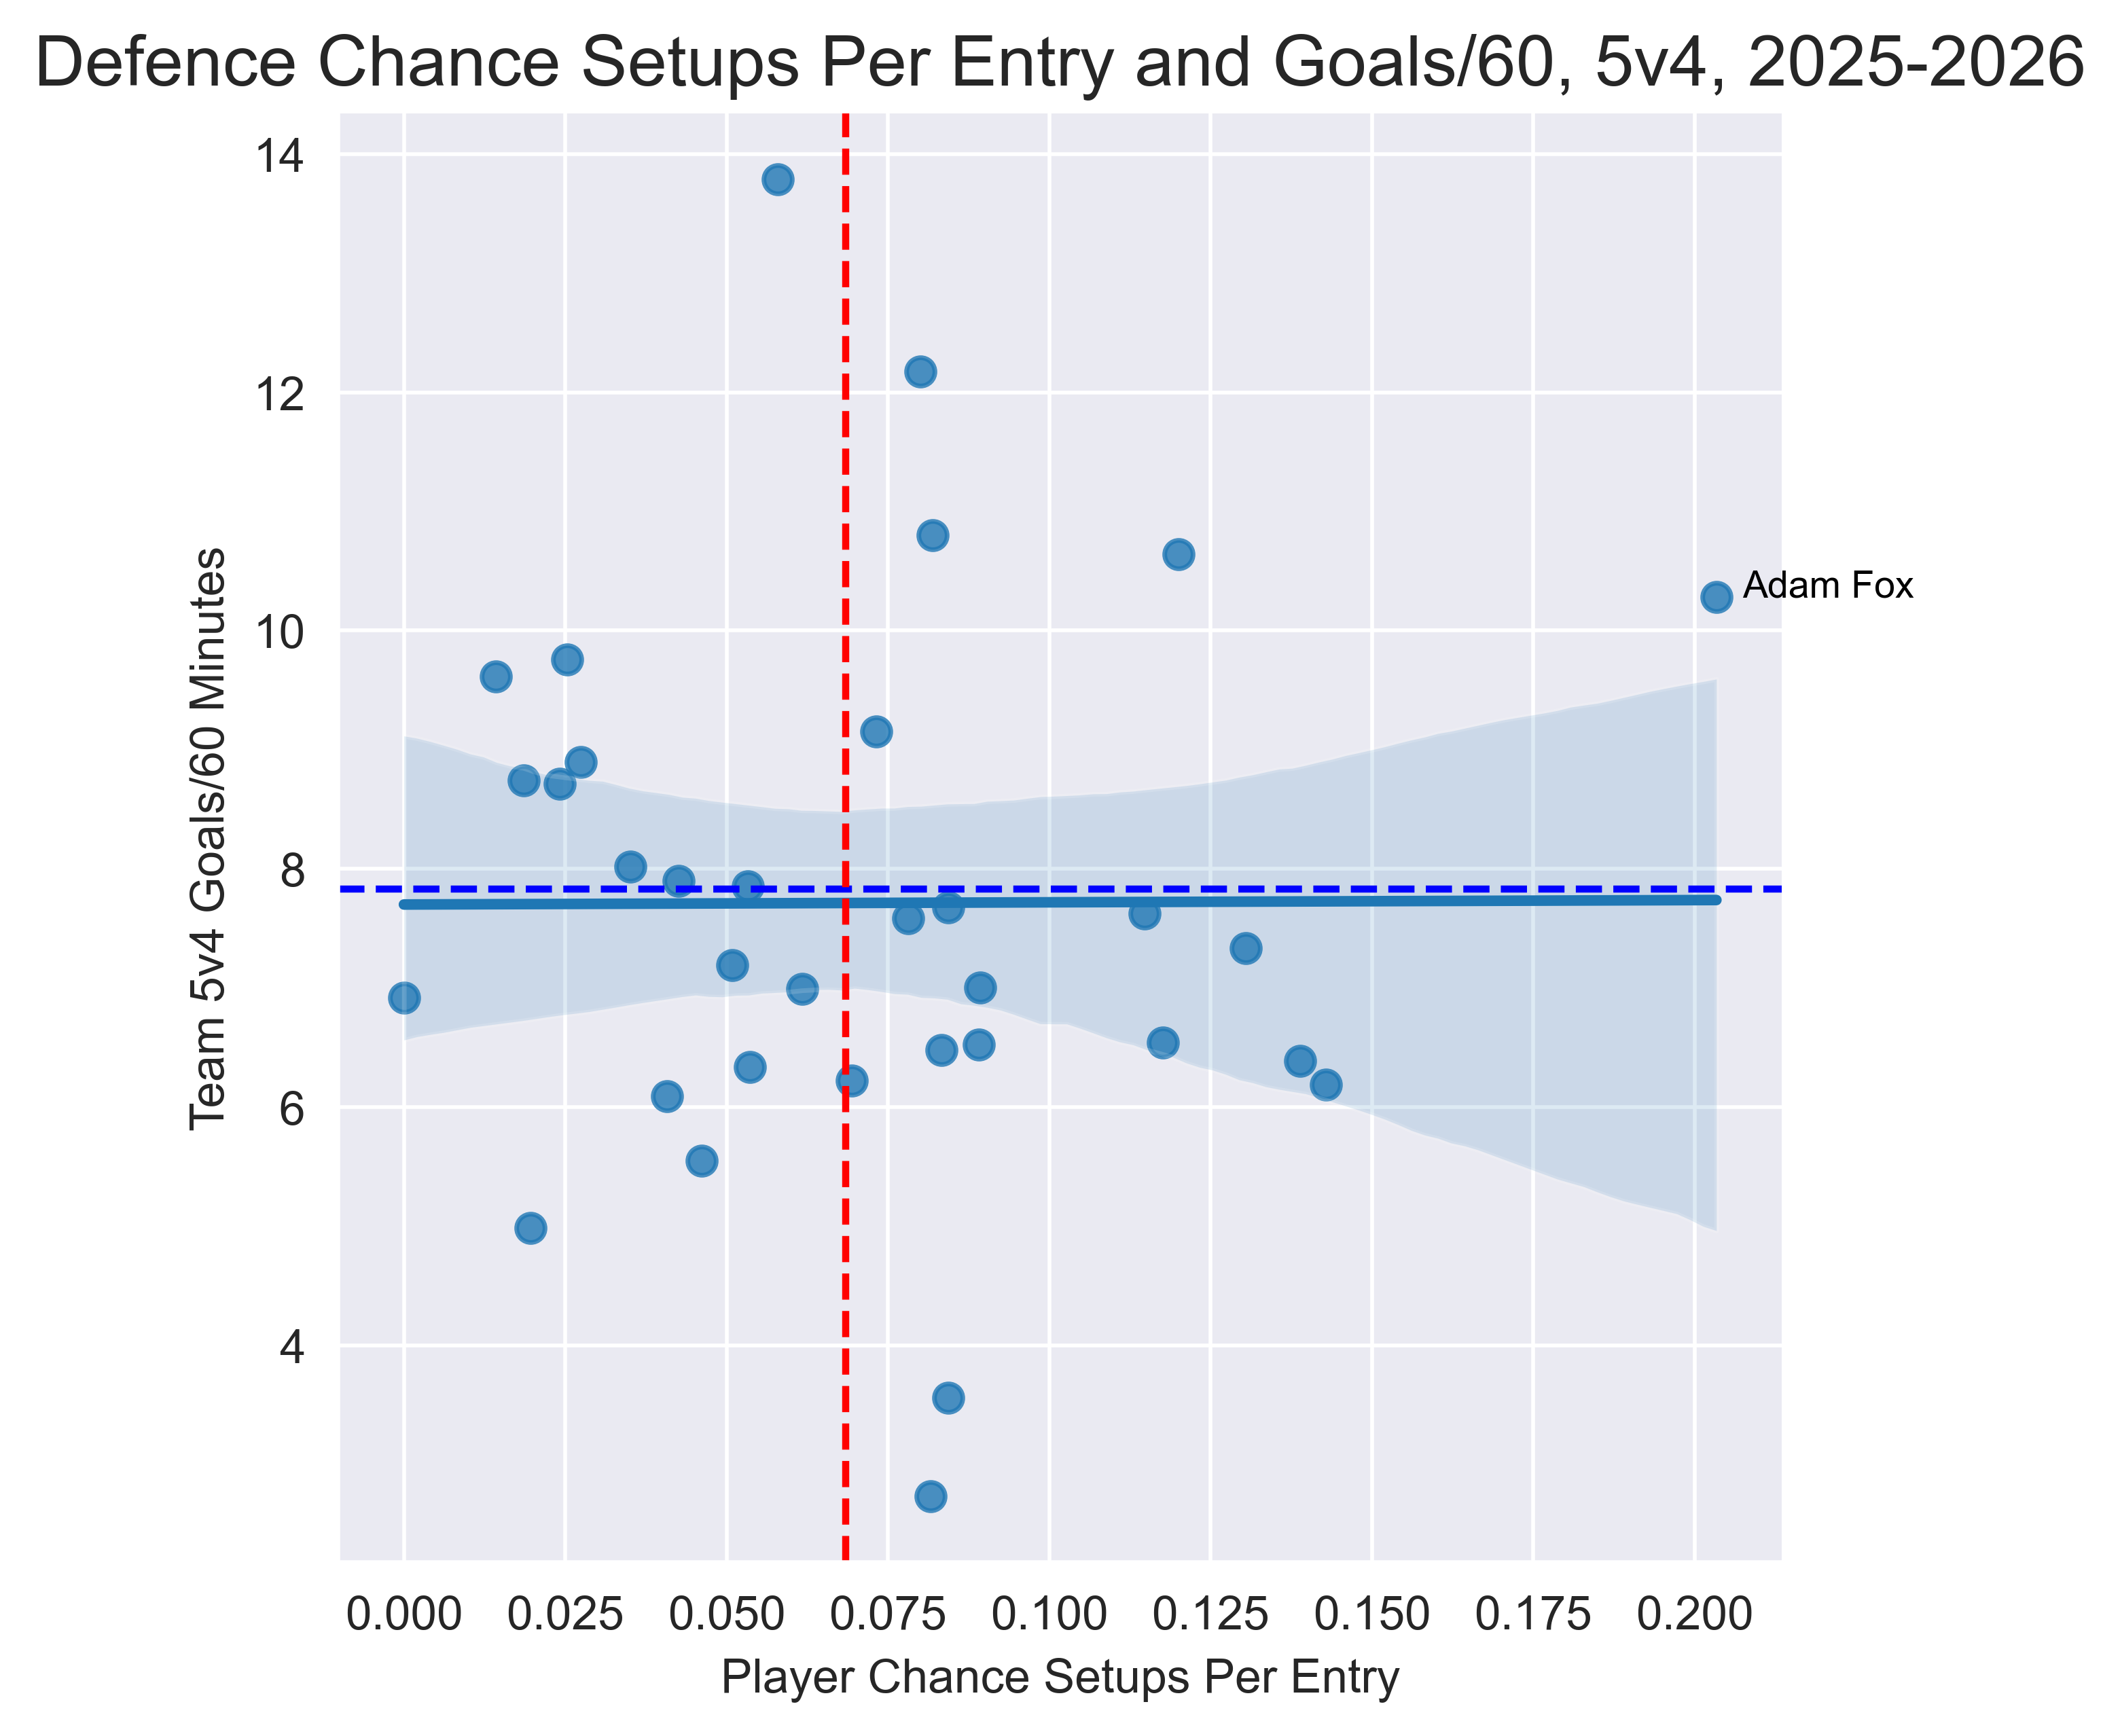
With Adam Fox off the top PP unit this season, the New York Rangers are seeing their goal-scoring rate decline over 42%. Across the last 3.5 seasons, their goal-scoring rate declines by 30% without Fox on the ice. Whatever else people may think about his game, his impact on the power play is a significant one.
Until next week.