10 Interesting (To Me) Stats For This Week - June 17
Welcome back for another week of ’10 Interesting (To Me) Stats’. Game 6 of the Stanley Cup Final is Tuesday night with Edmonton needing a win in Florida to stay alive. Seeing as this will be the last playoff breakdown of the year, let’s go through the first five games and how each team got to where they are. As usual, player data from Natural Stat Trick or Evolving Hockey with tracking data from AllThreeZones. We will have five points on each team, and let’s start with Florida.
*Note: At time of writing, the tracking data has just Games 1-4, though given what we’re talking about, missing Game 5 from the data likely doesn’t change much.
1 – More of the Same
We have talked about Florida’s ability to get to the net before, so it’s very much worth highlighting what they’re doing to Edmonton in that regard. Through the first five games, here are the average 5-on-5 shot distances faced by the goalies of each team:

For some context here, in the regular season, Sergei Bobrovsky had the furthest distance of average shot faced, and it was 39.8 feet. Through the first five games of the postseason, Edmonton’s average shot distance against Bobrovsky is nearly six feet further than the farthest average distance in the regular season. There is a good reason why the Oilers are sitting at 1.9 goals/60 minutes at 5-on-5 in the Final.
2 – Cycle of Death
This series is a clash of styles as the regular season saw the Panthers create the third-highest rate of offence off the cycle/forecheck in the league while Edmonton had the fifth-highest rate of offence off the rush. That has held true in the Final, but the issue is that compared to the opponent, Florida is creating more off the cycle/forecheck than Edmonton is off the rush while the gap in the other direction is smaller:

The tracking data is missing Game 5, but it’s safe to assume that this trend persisted. If Edmonton doesn’t slow down the Florida forecheck, or find more chances of their own, it will be very difficult to win two games in a row.
3 – More of the Same, Part Deux
The Cup Final preview mentioned how Florida’s top pair of Aaron Ekblad and Gustav Forsling was doing well controlling the play but was giving up a lot defensively. The first five games have seen them continue to give up a lot defensively, but not control the play when they’re on the ice compared to when they’re off the ice by rate of shot attempts against and share (CA/60 and CF%), shots against and share (SA/60 and SF%, and expected goals against and share (xG/60A and xGA%):

The top pair is getting .959 goaltending from Bobrovsky when they’re on the ice, and that’s saved them so far this series. It is one of those things where one more game of that type of goaltending from Bobrovsky probably sees the Panthers lift the Stanley Cup, but if it regresses, Edmonton could very well be lifting a Cup of their own in two days’ time. Fine margins.
4 – Year of the Rat
If there was an MVP just for the Cup Final, Brad Marchand would probably be it. He has six goals in five games, which leads all skaters, but he’s also doing a lot under the hood to support that: at 5-on-5, Marchand leads Florida forwards by rate of assists on teammate scoring chances, overall scoring chance contributions, high-danger passes, and offence off the rush, while being second by offence off the cycle/forecheck:
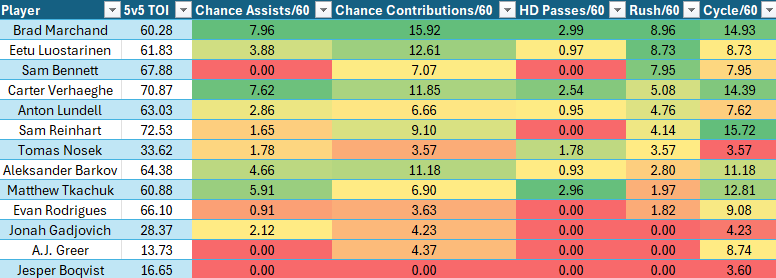
At 37 years old, Marchand is turning in an elite Cup Final appearance that has his team one game away from back-to-back Stanley Cups, and goes far beyond just the goals he’s scoring (though that certainly helps).
5 – Turned the Tide
It isn’t often that a goalie gives up three goals in a period, four goals in 60 minutes, and may have turned in a performance that wins his team their series. That very well may be what Bobrovsky did in Game 2. Edmonton had a 3-2 lead after the first period, scoring three goals on 14 shots before Bobrovsky really shut things down. He gave up a late tying goal to Corey Perry that forced overtime, but from the second period onward, Edmonton created nearly 3.9 expected goals and Bobrovsky saved every shot but that one from Perry:
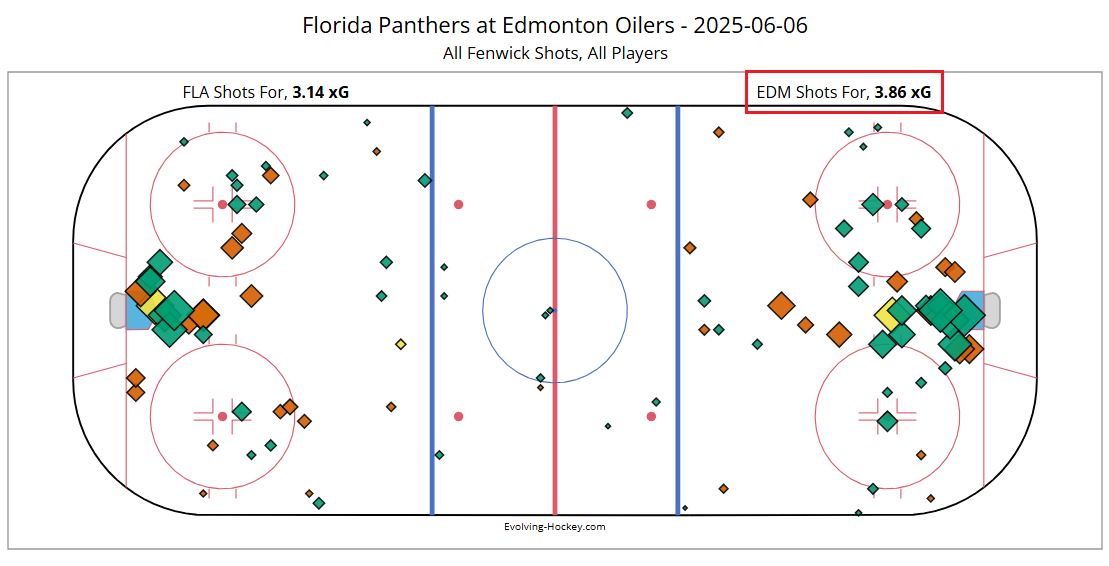
Any further misstep from Bobrovsky and Edmonton starts the series up 2-0 and we’re looking at a whole different ball game. Bob fell behind, but refused to fall further, and earning that split in the first two games was huge for him and the Panthers.
6 – Something More
We’ve all watched the games, and we know Florida has scored some goals off scrambles or missed assignments from Edmonton skaters that made life hard on their goalies. With that said, there has still been a clear difference between Bobrovsky and Edmonton’s goaltending as the Goals Saved Above Expected per 60 minutes at 5-on-5 is not even close:

Edmonton has taken far too many penalties, and that’s made life worse on their netminders. Setting that aside, the GSAx/60 at 5-on-5 difference of about three total goals matters a lot in a series where three of the five games have gone to overtime.
7 – System Failure
Our Cup Final preview highlighted how Edmonton’s defence group was the best puck-moving defence group they had in recent history and how that would be important against Florida’s relentless forecheck. So far, Florida’s forecheck is winning that battle as Edmonton’s defence group has seen their rates of zone exits with possession and puck retrievals leading to exits both decline while their zone exit failure rate has increased:

Just watching Games 1-5 would have told us the same story, but this is confirmation our eyes aren’t deceiving us: Florida’s forecheck has been a nightmare for Edmonton’s defence group that is leading to giveaways and goals against.
8 – I Wanted to Win the Cup, but Then I Lost Hy(man)
In the Cup Final, Edmonton has generated 61 shots at 5-on-5 with Connor McDavid on the ice, and scored just three goals, shooting 4.9%. With the news of Zach Hyman’s season-ending injury, my read was that the loss would be felt far more on the defensive side of the puck. While that defensive loss has been realized, it’s clear that there has been a sizeable impact offensively as the rates of shot attempts, expected goals, and goals are all way down:

The hope was that someone like Evander Kane, Jeff Skinner, or Viktor Arvidsson could pick up some of the scoring slack, but it just hasn’t happened, and unless they start to find some finish in McDavid’s minutes, the Oilers themselves will be finished.
9 – Can The Buck the Trend?
The Cup Final preview highlighted just how bad Edmonton’s penalty kill has been and while their 60-minute rate of goals against in the Final (9.2) is better than the first three rounds (11.6), they have given Florida 23 (!) power plays. While 11 of those came in Game 3, it has led to five goals against in five games at 4-on-5. That has pushed Edmonton to 20 goals against at 4-on-5 in the postseason. Since 2007, here are the five teams who’ve allowed the most goals against at 4-on-5 in a single playoff run. Edmonton is one of those five, and the other four lost in their Final:
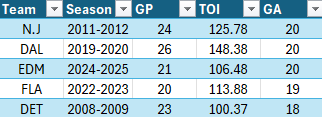
Whether just staying out of the box or further improving their goals against, Edmonton can’t keep giving up goals on the PK like this. It is costing them a Stanley Cup.
10 – Sometimes Maybe Good, Sometimes Maybe Shit
As a wise man once said, “You don’t score, until you score.” Aside from Edmonton’s penalty penchant, the difference has been Florida finishing their chances and Edmonton not doing that. To highlight that point, here is how Sam Bennett and Brad Marchand have compared to Ryan Nugent-Hopkins and Trent Frederic in terms of individual expected goals, both overall and per 60 minutes, at 5-on-5, and actual goals scored:

Sometimes she goes, sometimes she don’t. For a lot of Edmonton skaters right now, she don’t.
Until next week.