10 Interesting (To Me) Stats For This Week - March 24
Welcome back for another week of ’10 Interesting Stats’ and we are a day early because of some scheduling in my personal life.
This week, we have a theme again, and it is penalties. There has been chatter over the last week about the NHL about the drop in power plays, which is true: Hockey Reference has teams averaging 2.71 power-play opportunities per game, which is the lowest mark since the league started tracking PP opportunities in 1963. Using data from Hockey Reference, Evolving Hockey, and AllThreeZones, let’s look at some trends in penalties since the start of the 2021-22 season.
We are focusing solely on 2-minute penalties, so 5-minute misconducts are not included, and data is as of the morning of March 23rd.
1 – Long Time Coming
While penalty opportunities are their lowest since they’ve been tracked, it isn’t as if this is out of nowhere. The second- and third-lowest PP opportunity seasons were the Bubble year and in 2021-22. In fact, the decline in PP opportunities per game is part of a larger 30-year trend dating to the 1995 lockout, and kicking into another gear after the 2005 lockout (the two red circles):
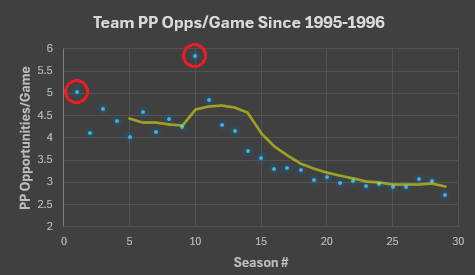
The 2024-25 season represents a 60-year low rate in PP opportunities, but it isn’t as if this was completely unforeseeable. This has been the trend since the mid-1990s, and particularly in the last 20 years.
2 – Trend Or Unicorn
That 30-year trend aside, what is happening this season is an outlier even as the rates of PP opportunities have been largely declining. The 2022-23 season saw modest increases in the rate of two-minute penalties drawn and taken when compared to 2021-22, a slight drop in 2023-24 when compared to the year prior, and then a huge drop this season:

This is a large drop given the relative stability of the previous decade. Overall, PP opportunities have declined over 10% from last season, the largest single-season change in 15 years.
3 – Positional Play
What is notable about the changes in drawing/taking penalties is that they are varying between forwards and defencemen, too. Compared to the 2023-24 season, defencemen are taking far fewer penalties, and forwards saw a larger percentage drop in penalties drawn (-8.8%) than defencemen (-8.5%):

In fact, compared to 2021-22, forwards are drawing 7% fewer penalties per 60 minutes overall. That might not seem like a massive drop, but when forwards typically draw over 6000 penalties a season, we are talking about 425 fewer penalties drawn by forwards alone. It is a lot.
4 – Fast Break
One hypothesis is that tracking data shows a sizeable drop in offence created off the rush over the last two seasons when compared to the two years prior, and that is affecting penalties drawn.
The first thing we have to look for is whether forwards who create well off the rush actually draw more power plays. The answer to that question is: Yes, with a caveat. The caveat is that players who create the most off the rush often create well off the cycle. Those are your elite offensive players like Auston Matthews, Connor McDavid, and Jack Hughes. So, if we exclude players who are one standard deviation above average by creating off the cycle, and then look at the top rush offence players remaining, what does that look like? Well:

Forwards who are among the best at creating off the rush, even when excluding the elite offensive players, are now drawing more penalties than the average forward.
5 – Stop The Cycle
Let’s look at the other half of offensive play: Creating off the cycle/forecheck. We will do something similar to what we just did by excluding the top rush offence forwards and then looking at the top cycle forwards remaining. Let’s look at forwards who are outside the top standard deviation of creating off the rush, but are at the top of the leaderboard at creating off the cycle/forecheck, and their penalties drawn in the previous pairs of seasons:

Not only do these cycle-heavy players draw fewer penalties than their rush-heavy counterparts, but the rate at which they’re drawing penalties is declining fast.
6 – Top Drop
Now that we know forwards are drawing fewer penalties, and that players who create off the rush draw more penalties as the league is creating less off the rush overall, what about specific players? Well, let’s look at NHLers with a positive penalty differential who had at least 2000 minutes from the 2021-2024 seasons – which gives us 220 players – and how they’re faring in 2024-25:

That is… drastic. The players who managed a positive penalty differential from 2021-2024 have seen that differential drop 30%.
7 – Jesus Christ, Superstar
The note above is just the drop of players with a positive differential from 2021-2024. There could be some variations from players close to the break-even point. So, what if we looked at just the high-end players in terms of penalty differentials? Again, using the 2000-minute cutoff from 2021-2024, here is how players who were at least one standard deviation above average in those seasons by penalty differential/60 minutes are managing in 2024-25:

Yes, the excellent-to-elite players by penalty differentials from 2021-2024 have seen that differential drop even more than just looking at all those who had a positive differential.
8 – Draw Me Like One Of Your French Refs
The question now is, are those players drawing fewer penalties or taking more penalties? Glad you asked. Starting with players who simply had a positive penalty differential from 2021-2024, here is how they drew penalties from 2021-2024 and are drawing penalties in 2024-25:

Looking at all the players from 2021-2024 with 2000+ minutes, not just the ones with a positive penalty differential, there has been a 12% drop in penalties drawn this season. Of those with a positive penalty differential, the drop is 16%. The players who were typically great at drawing penalties are not getting the same rate of calls they used to.
9 – Bad, Bad, Bad, Bay Boy
It is worthwhile, then, checking at what’s happening to players who typically have bad penalty differentials,. So, with that same group of 2000-minute players from 2021-2024, here is how they’re faring by penalty differential in 2024-25. It is something else:

Yes, players who typically have a negative penalty differential still have a negative penalty differential. However, that rate has actually improved this season by nearly 20%. Compare that to the players who typically have a positive differential seeing that percentage decline by 30%, and things are really starting to get confusing.
10 – Sum Of All Years
I try not to stray from the typical format and offer 10 stats, but given all that’s been offered here, I think it’s worth taking this section to summarize what we’ve seen:
· The decline in power play opportunities this season is stark, but part of a larger 20-year trend.
· Forwards are seeing a slightly larger drop in penalties drawn than defencemen
· Forwards who create well off the rush do draw more penalties, but rush offence across the league is declining
· Forwards who create well off the cycle draw fewer penalties
· Regular players who had a positive penalty differential from 2021-2024 have seen their rate of penalty differential/60 minutes drop 30% this season
· Regular players who had great penalty differentials from 2021-2024 have dropped even more, closer to 37%
· Players with a positive penalty differential from 2021-2024 have seen a larger drop in rate of penalties drawn this season than the league average
· Players with a negative penalty differential from 2021-2024 have actually seen that rate improve by nearly 20%
My general theory is that as the league becomes more skilled, the gap in penalty-taking/drawing for the wide majority of players is closing. It is also plausible that players who were great at creating positive penalty differentials are just getting older/worse at it. All this is quite interesting because there are a lot of changes going on in how the game is being called.
Until next week.