10 Interesting (To Me) Stats For This Week - September 9
Welcome back for another round of ’10 Interesting Stats’. The last couple of weeks have seen the season previews begin, starting with what non-playoff teams from 2024-25 need to do to get to the postseason, and moving to what some playoff teams need to do to remain in the postseason picture.
Today, we’re again looking at playoff teams, but for common characteristics. What do teams who reach the Stanley Cup Playoffs have in common (or not)? Let’s look at that.
Player and team data from Evolving Hockey with tracking data from AllThreeZones. If tracking data is mentioned, it is at 5-on-5.
1 – You Again?
One quirk of the NHL is that top players are rarely moved, which has various reasons, but a big one is that you need to make the playoffs to win the Stanley Cup, and making the playoffs one year is a pretty good indicator you’ll make it the next year. Starting with the 2022 postseason, here are how many playoff teams make it one year and then reach the season-end tournament again the next year:
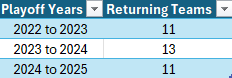
That is three straight seasons with at least 11 returning teams and averaging about 12 each year. Like everything in sports, there are always outliers, but on average, playoff teams in any given year have about a 73% chance of returning the following year. Winning a Cup often requires good teams to make several postseason trips before getting over the hump, and that is a big reason why we don’t see significant names change locales very often.
2 – Average Works
The best advice I ever got that I never really followed is, “Everything is fine in moderation.” This applies to goals-for and goals-against for playoff teams because they can’t be awful scoring or preventing goals and find their way to the postseason. Here are the number of playoff teams from each of the last four postseasons to be in the bottom-5 of the regular season by either total goals for or total goals against:
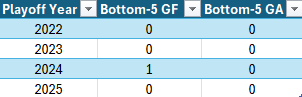
Out of the last 64 playoff teams, exactly one was in the bottom-5 by either goals for or goals against in the regular season: The 2023-24 Washington Capitals finished 28th by goals scored.
3 – One or the Other, Part 1
While being great at 5-on-5 will help get to the postseason, a team doesn’t necessarily need to be good at 5-on-5 to get there (going deep is another matter). The 2025 postseason saw both the Montreal Canadiens and Ottawa Senators reach the tournament with a minus-23 and minus-18 goal differential, respectively, at 5-on-5. What they did instead was create a goal advantage on special teams:
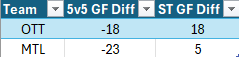
Again, going deep in the postseason requires a more balanced team, and both these squads were knocked out in the first round. But there is more than one way to eat a pie, and the Canadiens and Senators showed us that.
4 – One or the Other, Part 2
PDO is simply adding a team’s shooting and save percentages together, which is probably poor form, but it can help give us an indication of luck (or unluckiness). Expected goal share (xGF%) tells us how much of the shot quality a particular team controls. A playoff team can have a bad regular season PDO, or a bad regular season xGF%, but not both. Here are the number of teams from each of the past four playoffs to have a bottom-8 PDO with a top-8 xGF% or a top-8 PDO with a bottom-8 xGF% (from Natural Stat Trick):
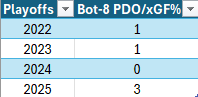
It is notable that the most recent playoffs saw more teams than the prior three combined, which makes us wonder if it was an outlier year or the start of a new trend. Regardless, a poor PDO or xGF% isn’t a death knell for a team’s playoff chances, but 5 out of 64 teams is still a low success rate.
5 – Revenge of the Nerds
The analytics debate is tiresome mainly because things like xGF% have shown repeatedly, for years, that they will be a huge factor in a team getting to the postseason. Let’s look at the top-10 xGF% teams from each of the last four regular seasons, the bottom-10 teams, and how many playoff teams each group produced:
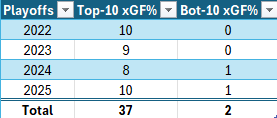
Of the 40 teams to finish in the top-10 by regular season xGF% in each the last four years, 37 of them made the postseason. Of the 40 teams to finish in the bottom-10 by regular season xGF% in each of the last four years, two of them reached the playoffs. That is a 93% success rate against a 5% success rate. Choose your fighter.
6 – Gotta Contribute
Using the tracking data, we can rank teams by scoring chance contributions per 60 minutes (SCC/60) at 5-on-5, which is simply individual chances and assists on teammate scoring chances. As with expected goals, let’s find the number of playoff teams the top-10 rosters by SCC/60 produced in each of the past four years, and the number of playoff teams from the bottom-10:
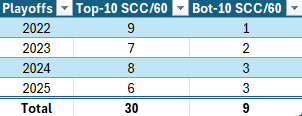
Not as extreme as the xGF% totals, but that’s still a 75% success rate against a 23% success rate. Also, it’s worth mentioning that the 11th-, 12th-, 13th-, and 14th-place teams by SCC/60 this past regular season were all playoff teams and their SCC/60 was less than 1% behind 10th place. So, yeah, it matters.
7 – Be Different
Other tracked areas include offence off the rush, cycle, and forecheck (shots and assists of each type). It is interesting to do the same thing – playoff teams each year from the top-10 and bottom-10 in offence created off the rush or cycle/forecheck – and see the difference compared to SCC/60:
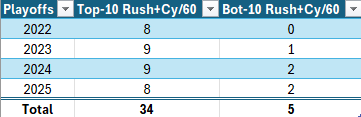
That is an 85% success rate for top-10 teams (up from 75% by SCC/60) and a 13% success rate for bottom-10 teams (down from 20% for SCC/60). Being able to create high rates of offence in a variety of ways is a good thing. Who knew?
8 – Carry On
We know that teams whose zone entries are often carried in are often pretty good at generating offence. But is it a characteristic of playoff teams? In a word: yes, but with caveats. Again, here are the number of playoff teams from each of the last four years by top-10 and bottom-10 percentage of entries carried in (Carry%):
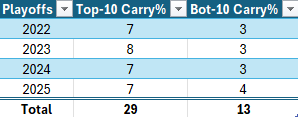
The success rates here – 73% and 33% - are the closest we’ve seen. It is still better, but four of the high-end dump-and-chase teams over the last four years are Florida, Carolina, Toronto, and Minnesota, and they have one missed playoff appearance combined in that span (Minnesota in 2024).
9 – Get Moving
The last few stats are for the whole team, but defencemen have become more integrated into the offence over the last decade. Things get interesting when looking at playoff squads from the top-10 and bottom-10 teams by percentage of zone exits with possession by their defencemen:
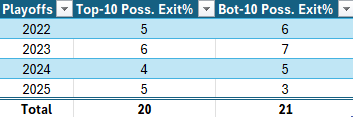
That’s right: the success rate of reaching the playoffs as a bottom-10 team by percentage of zone exits with possession by defencemen is higher than the success rate of top-10 teams. This is why it’s important to not just blindly follow any new stats, tracking or otherwise. It is important to separate what is interesting to talk about and what is actually useful for teams. Considering that Florida, Vegas, Dallas, and Carolina are four of the 10 worst teams by possession exit% over the last four years, it’s worth asking, “is this helpful?”
10 – Keep It Clean
Zone exits with possession may not matter but turning the puck over sure as hell does. Here are the number of playoff teams from each of the last four years with the 10 highest percentage of failed zone exits by their defencemen, and the 10 lowest percentage of failed zone exits:
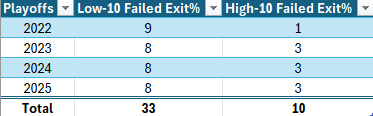
That is an 83% success rate for teams who keep their failed zone exits low, and a 25% success rate for teams who have a high percentage of failed zone exits. Over the last four years, among the 10 teams with the lowest percentage of failed zone exits are Florida, Vegas, Winnipeg, Colorado, Tampa Bay, Minnesota, and Carolina. At the other end are teams like Columbus, Anaheim, San Jose, Arizona/Utah, Buffalo, Montreal, Ottawa, and Chicago. Teams might not necessarily need to have the puck on their players’ sticks as they exit the zone, but they need to get the puck out one way or another.
Until next week.